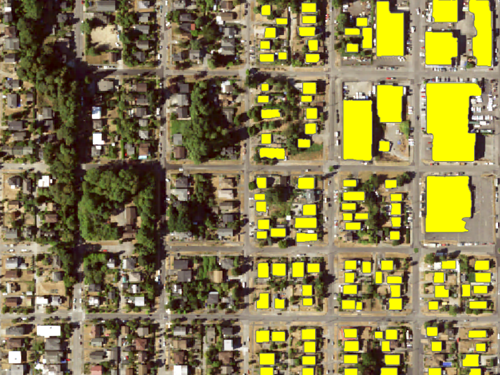
Map floods with SAR data and deep learning
To conduct this analysis, you'll first extract the pixels that represent water in pre- and post-flood Sentinel-1 SAR imagery using a deep learning pretrained model. Then, you'll perform change detection between the two extracted water rasters to identify the flooded areas. Finally, you'll compute the total surface area affected by the flood in square kilometers.
Set up the project and explore the data
To get started, you'll download a project that contains the data you need for this tutorial and open it in ArcGIS Pro. Then you'll start exploring the data.
- Download the Flood_mapping package.
A file named Flood_mapping.ppkx is downloaded to your computer.
Note:
A .ppkx file is an ArcGIS Pro project package and may contain maps, data, and other files that you can open in ArcGIS Pro. Learn more about managing .ppkx files in this guide.
- Locate the downloaded file on your computer.
Tip:
In most web browsers, files are downloaded to the Downloads folder.
- Double-click Flood_mapping.ppkx to open it in ArcGIS Pro. If prompted, sign in with your ArcGIS account.
Note:
If you don't have access to ArcGIS Pro or an ArcGIS account, see options for software access.
The project opens.

The project contains four maps: Compare SAR Imagery, Post Flood, Pre Flood, and Change Detection. For now, you'll work in the first of these maps.
- Ensure that the Compare SAR Imagery map is selected.

The map contains two synthetic aperture radar (SAR) satellite images, Pre_Flood_SAR_Composite and Post_Flood_SAR_Composite, depicting the area of interest before and after the St. Louis 2019 flood. Currently, only the pre-flood layer is visible, displaying over the default World Topographic basemap. The black or darker gray tones indicate water-covered areas and clearly delineate the Mississippi, Illinois, and Missouri rivers.

Satellites with SAR sensors produce images based on radar technology. One of SAR's strengths is that it can create clear images in both daytime and nighttime and regardless of the presence of clouds, smoke, or rain. This makes SAR imagery a very good choice to map a flood.
Note:
To learn more about SAR, refer to the Explore SAR satellite imagery tutorial and the Getting started with SAR satellite imagery series.
These two layers were derived from Sentinel-1 GRD SAR imagery captured on February 23 and June 11, 2019.
Note:
Some preprocessing steps were applied to the original Sentinel-1 GRD datasets to prepare them for analysis, including creating image composites. To learn how to obtain Sentinel-1 GRD datasets for your own area of interest and how to prepare them, refer to the second module of this tutorial, Apply this workflow to your own area of interest.
You'll use the Swipe tool to compare the two images visually.
- In the Contents pane, click the Pre_Flood_SAR_Composite layer to select it.

- On the ribbon, click the Raster Layer tab. In the Compare group, click Swipe.

- On the map, drag the cursor from top to bottom to peel off the Pre_Flood_SAR_Composite layer and reveal the Post_Flood_SAR_Composite layer underneath.

In the post-flood image, there are many more water-covered areas, appearing in black tones.
As a point of comparison, optical satellite imagery (Sentinel-2) for the post-flood time period presents a thick layer of clouds due to the weather conditions and could not be used to detect flooded areas on the ground.

Post-flood Sentinel-2 optical imagery presenting a thick layer of clouds. - On the map, zoom in and out with the mouse wheel and continue to swipe to examine the SAR imagery in more detail.
Tip:
To pan the map while the Swipe tool is active, press the C key and drag.
- To exit swipe mode, on the ribbon, on the Map tab, in the Navigate group, click Explore.

Download a deep learning pretrained model
To extract the pixels that represent water in the SAR images, you'll use a deep learning pretrained model named Water Body Extraction (SAR) - USA. It was trained to detect water pixels in SAR images and is available through ArcGIS Living Atlas of the World. You'll download the model to your computer.
Note:
ArcGIS Living Atlas of the World is Esri's authoritative collection of GIS data, and it includes a growing library of deep learning pretrained models.
- Open ArcGIS Living Atlas of the World in your web browser.
- On the home page, in the search box, type Water Body Extraction (SAR) - USA and click the search button.

- In the list of results, click Water Body Extraction (SAR) - USA to open its item page.

The item page contains documentation about the model. It also includes a link to a guide to using the model.
- At the top of the page, under Overview, click Download.

The model file downloads to your computer.
- Locate the downloaded WaterbodyExtractionSAR_USA.dlpk file on your computer and move it to a folder where you can find it easily, such as C:\GeoAI.
Extract the water pixels
You'll now use the downloaded pretrained model to extract the water pixels from the pre-flood image. You'll use the Classify Pixels Using Deep Learning geoprocessing tool.
Note:
Using the deep learning tools in ArcGIS Pro requires that you have the correct deep learning libraries installed on your computer. If you do not have these files installed, save your project, close ArcGIS Pro, and follow the steps delineated in the Get ready for deep learning in ArcGIS Pro instructions. In these instructions, you will also learn how to check whether your computer hardware and software are able to run deep learning workflows and other useful tips. Once done, you can reopen your project and continue with the tutorial.
You'll perform the water pixel extraction in the second map.
- Click the Pre Flood map tab.

This map contains the Pre_Flood_SAR_Composite layer. Processing the entire SAR image with the Classify Pixels Using Deep Learning tool can take anywhere between 40 minutes and 4 hours depending on your computer specifications. For the brevity of this tutorial, you'll only process a small portion of the image.
- On the ribbon, on the Map tab, in the Navigate group, click Bookmarks and choose Smaller extent.

The map zooms to a smaller extent toward the center of the SAR image.

You'll now open the tool and choose its parameters.
- On the ribbon, on the View tab, in the Windows group, click Geoprocessing.

- In the Geoprocessing pane, in the search box, type Classify Pixels Using Deep Learning. In the list of results, click the Classify Pixels Using Deep Learning tool to open it.

- In the Classify Pixels Using Deep Learning tool, set the following parameters:
- For Input Raster, choose Pre_Flood_SAR_Composite.
- For Output Raster Dataset, type Pre_Flood_Water_Small_Extent.

You'll now retrieve the Water Body Extraction (SAR) - USA model.
- Next to the Model Definition parameter, click the Browse button.

- In the Model Definition window, browse to the folder where you saved the model, select WaterbodyExtractionSAR_USA.dlpk, and click OK.

After a few moments, the model arguments load automatically.
- Under Arguments, locate the batch_size argument.
Deep learning pixel classification cannot be performed on the entire image at one time. Instead, the tool will cut the image into small pieces known as chips. A batch size of 4 means that the tool will process four image chips at a time. As you run the tool, you may receive an error because your computer doesn't have enough memory for that level of processing. In that case, try decreasing the batch_size value from 4 to 2 or even 1. If you have a powerful computer, you could also increase the batch_size value for faster processing. Changing the batch_size value will not affect the quality of the results, only the efficiency of the model's classification process.
For now, you'll keep the default value of 4.
- Under Arguments, for test_time_augmentation, type True.
If this argument is set to True, data augmentation will be applied: multiple versions of image chips will be created by flipping and rotating them and the resulting predictions will be merged into the final output.

Note:
Refer to the Classify Pixels Using Deep Learning documentation for more information about the model arguments.
You'll now specify the processing extent in the Environments parameters to limit it to the smaller portion of the image currently displaying on the map.
- Click the Environments tab.

- Under Extent, click the Current Display Extent button.

The extent coordinates update in the Top, Left, Right, and Bottom parameters, based on the map's current extent.
- Under Processor Type, choose GPU. For GPU ID, type 0.
Note:
For this tutorial, it is assumed that your computer has an NVIDIA GPU. If it doesn't, choose CPU, but realize that the process will take much longer to run. To learn more about GPUs and how they are used for deep learning processes, see the Check for GPU availability section in the Get ready for deep learning in ArcGIS Pro tutorial.

You are now set to run the tool.
Caution:
Based on your computer's specifications, this process will take some time. For reference, on a computer with a 4 GB Nvidia GPU, it takes about 7 minutes.
If you prefer not to run this process to save time, you can instead open an output raster that was provided in the project. In the Catalog pane, browse to Databases and Flood_mapping.gdb. Right-click Pre_Flood_Water_Small_Extent_Provided and choose Add To Current Map.
- If you choose to run the process yourself, click Run.
While the tool is processing, you can click View Details for more information.

Tip:
If you get an error, try decreasing the batch_size value from 4 to 2 or even 1 and run the process again.
After the process is complete, the Pre_Flood_Water_Small_Extent output raster appears in the Contents pane.
- On the Quick Access toolbar, click the Save Project button to save your project

You extracted the water pixels from the pre-flood imagery for a portion of the St. Louis region using the Classify Pixels Using Deep Learning tool and the Water Bodies Extraction (SAR) – USA pretrained model. Next, you'll observe the results.
Observe the water raster output
You'll use the Swipe tool to compare the pre-flood water raster and the SAR image.
- In the Contents pane, ensure that the Pre_Flood_Water_Small_Extent layer is selected.

- On the ribbon, on the Raster Layer tab, click Swipe.

- On the map, drag from top to bottom to peel off the Pre_Flood_Water_Small_Extent layer and reveal the Pre_Flood_SAR_Composite layer underneath.

While swiping, observe how the extracted water pixels, displayed in purple, match the darker areas of the SAR image. Since this is the pre-flood SAR image, these pixels correspond to permanent water bodies, such as rivers and lakes.
Next, you would need to extract the water pixels from the post-flood SAR image, following the same steps. However, to ensure the brevity of this tutorial, this step was completed for you. You'll now review its output.
- Click the Post Flood map tab.

This map contains the post-flood SAR image and the water raster extracted from it on the same smaller extent used previously.
- In the Contents pane, select the Post_Flood_Water_Small_Extent layer.

- On the map, drag from top to bottom to peel off the Post_Flood_Water layer and reveal the Post_Flood_SAR_Composite layer underneath.

While swiping, observe how the extracted water pixels, displayed in purple, match the darker areas of the SAR image. Since this is the post-flood SAR image, these pixels correspond to permanent water bodies, such as rivers and lakes, but also areas covered with water as a result of the flood.
- To exit swipe mode, on the ribbon, on the Map tab, click Explore.

Now that you have extracted the water pixels from the pre- and post-flood images, the next step is to understand what has changed between the two.
Perform change detection analysis
To identify the flooded areas, you need to perform a change detection analysis comparing the pre- and post-flood rasters. You want to find the pixels that went from non-water to water. You'll do that in the fourth map using the Change Detection Wizard.
- Click the Change Detection map tab.

This map contains the pre- and post-flood water rasters that were extracted from the SAR images.

Note:
These larger rasters were generated using the Classify Pixels Using Deep Learning tool with the same parameters used earlier, with the exception of the Extent parameter, which was defined as the Intersection of Inputs.

You'll conduct the change detection analysis on that larger extent. But first, you need to perform a preprocessing step. The water rasters obtained from the Classify Pixels Using Deep Learning tool contain only a single class, with the value of 1, representing water pixels.

However, a binary raster is required for running change detection analysis. The binary raster will have two classes: 0 representing non-water pixels and 1 representing water pixels. You'll generate these binary rasters using the Equal To tool.
- In the Geoprocessing pane, click the Back button twice.

- Search for and open the Equal To tool.

You'll first apply the tool to the pre-flood raster.
- In the Equal To tool, set the following parameters:
- For Input raster or constant value 1, select Pre_Flood_Water.
- For Input raster or constant value 2, type 1.
- For Output raster, type Pre_Flood_Binary.

For each pixel, the tool will return 1 if Input raster or constant value 1 is equal to Input raster or constant value 2, and 0 otherwise.
- Click Run.
After a few moments, the binary raster is added to the map.

The binary raster has two classes: 0, symbolized in gray (non-water), and 1, symbolized in red (water).

- Similarly, use the Equal To tool to produce the Post_Flood_Binary raster.

After you run the tool, the post-flood binary raster is added to the map.

You'll now perform the change detection analysis.
- On the ribbon, on the Imagery tab, in the Analysis group, click Change Detection and choose Change Detection Wizard.

- In the Change Detection Wizard pane, on the Configure tab, set the following parameters:
- For Change Detection Method, choose Categorical Change.
- For From Raster, choose Pre_Flood_Binary.
- For To Raster, choose Post_Flood_Binary.
The binary raster values represent categories (water or non-water), which is why you choose the Categorical Change option.
Note:
Learn more about categorical change detection.

Note:
If you get the warning the standard Red, Blue, and Green fields not found, you can ignore it.
- Click Next.
- On the Class Configuration tab, set the following parameters:
- For Filter Method, verify that Changed Only is selected.
- For From Classes, check the box next to 0.
- For To Classes, check the box next to 1.
Only the pixels that went from non-water (0) to water (1) will be detected. These pixels represent the flooded areas.

- Click Next.
- On the Output Generation tab, set the following parameters:
- For Output Dataset, type Flood.crf.
- Accept the other default values.

- Click Run.
After a few moments, the Flood.crf output raster is added to the map. It has two pixel classes:
- 0->1, which represents the pixels that went non-water to water and corresponds to the flooded areas. It is symbolized in pink.
- Other, which represents any other pixels. It is symbolized as No Color (transparent).

Visualize the flood and compute its area
You'll change the symbology to better see the results, then you'll compute the total surface area affected by the flood.
- In the Contents pane, under Flood.crf, right-click the 0->1 symbol to display the color palette. Choose a deep red, such as Poinsettia Red.

- Uncheck the boxes next to the Post_Flood_Binary, Pre_Flood_Binary, and Post_Flood_Extracted_Water layers to turn them off.

- Right-click the Pre_Flood_Extracted_Water symbol and choose a deep blue, such as Cretan Blue.

- On the map, the extracted flood layer displays in red, and, for reference, the pre-flood water bodies display in blue.

Finally, you want to compute the surface area covered by the flood, measured in square kilometers.
- In the Contents pane, right-click the Flood.crf layer and choose Attribute Table.

The Flood.crf attribute table appears. It contains two rows, one for each class: 0->1 (flood pixels) and Other (other pixels). The Area column contains the total area for each class in square meters. For the flood class, it is 524,619,200.703 square meters.

Note:
Since deep learning classification is not a deterministic process, the area numbers you obtained might be slightly different.
Values in square meters can be difficult to interpret, so you'll add a new field to show the area in square kilometers.
- In the attribute table pane, click the Calculate button.

- In the Calculate Field window, set the following parameters:
- For Field Name (Existing or New), type Area_km2.
- For Field Type, choose Double (64-bit floating point).

The area in square kilometers is the area in square meters divided by 1,000,000. You'll form the corresponding expression.
- Under Expression, for Fields, double-click Area. Under Area_km23 =, complete the expression by typing /1000000.
The full expression reads !Area! / 1000000.

- Click Run.
A new Area_km2 field appears, populated with values. The flooded areas represent about 525 square kilometers.

- Close the Flood.crf attribute table.

- Press Ctrl+S to save the project.
In this workflow, you first extracted the pixels that represent water in pre- and post-flood Sentinel-1 SAR imagery using a deep learning pretrained model. Then, you performed change detection between the two extracted water rasters to identify the flooded areas. Finally, you calculated that a 525-square kilometer area was inundated in the St. Louis region during the 2019 Midwestern floods.
Apply this workflow to your own area of interest (optional)
Sentinel-1 imagery is available for the entire earth. If you want to apply the workflow you just learned to your own area of interest, this optional module explains where to find the data and how to prepare it for analysis.
Where to find Sentinel-1 GRD data
The data used in this workflow is Sentinel-1 Ground Range Detected (GRD) data. One of the websites where you can download Sentinel-1 GRD data for any location on earth for free is the ASF Data Search Vertex website. Below is some guidance on how to download SAR datasets similar to the ones you used in this tutorial for an extent of your choice.
- Make a free Earthdata Login Account, if you don’t already have one.
- On the ASF Data Search Vertex website, in the top toolbar, sign in with your Earthdata credentials.

- In the top toolbar, for Search Type, verify that Geographic Search is selected. For Dataset, verify that Sentinel-1 is selected.

- On the map, with the mouse wheel button, zoom in to your area of interest. Click and drag to draw a rectangle outlining your extent of interest, and click again to complete the rectangle.

In the top toolbar, the Area of Interest field is populated with the coordinates of the shape you just created.

- Use the calendar widgets to populate the Start Date and End Date fields. Click Filter.

- In the Filters window, under Additional Filters, choose the following options:
- For File Type, choose L1 Detected High-Res Dual-Pol (GRD-HD).
- For Beam Mode, choose IW.
- For Polarization, choose VV+VH.
- For Direction, choose Ascending.

- Click Search.
After a few moments, a list of SAR scenes corresponding to your search criteria appears.
- In the list, for a scene of your choice, click the Zoom to scene button, to preview the image on the map.

- If you are satisfied with that image, in the third column to the right, for the GRD-HD dataset, click the Download button.

The dataset downloads to your computer’s Downloads folder.
Download Sentinel-1 GRD example data
Once you have acquired data for your area of interest, you need to apply a few preprocessing steps to it, to make it ready for analysis. To practice, you'll download a Sentinel-1 GRD example dataset and open it in your ArcGIS Pro project. This is the dataset that was used to derive the Post_Flood_SAR_Composite layer used earlier in this tutorial.
- Download the Data_preparation.zip file and locate it on your computer.
- In Windows Explorer, right-click the Data_preparation.zip file and unzip it to a location on your computer, such as drive C:\data, using a utility tool such as 7-Zip.

- In ArcGIS Pro, on the ribbon, on the View tab, in the Windows group, click Catalog Pane.

The Catalog pane appears.
- In the Catalog pane, right-click Folders and choose Add Folder Connection.

- In the Add Folder Connection window, browse to the location of your Data_preparation folder, select it, and click OK.

You'll now open the Sentinel-1 GRD image in a new map.
- In the Catalog pane, click the arrow next to Folders, Data_preparation, Sentinel1, and S1A_IW_GRDH_1SDV_20190611T235618_20190611T235643_027639_031E97_AC44.SAFE to expand these folders.

- Right-click manifest.safe, point to Add To New, and choose Map.

- If prompted to create Pyramids and Statistics, click OK to accept.
Note:
Pyramids are reduced-resolution overviews of the image at different scales and are used to improve the drawing speed. Statistics are required to perform certain tasks on the imagery, such as rendering it with a stretch. Learn more about building pyramids and calculating statistics.
After a couple of minutes, the image is added to the new map under the name IW_manifest.

The image is ready to be preprocessed.
Apply orbit and geometric terrain correction
First, you'll apply orbit and geometric terrain correction.
Note:
If you skip these two steps, the deep learning classification and change detection analysis will still function; however, you risk getting results that are not accurately located on the map.
No matter how fine-tuned a satellite's orbit may be, the location of the satellite will drift due to gravitational influences and other factors. Up-to-date orbital files give the precise location of the satellite at the time the image was captured. You'll use the Download Orbit File tool to download the relevant orbital file.
- Switch to the Geoprocessing pane. If necessary, click the Back button.

- Search for and open the Download Orbit File tool.

- In the Download Orbit File tool, set the following parameters:
- For Input Radar Data, choose IW_manifest.
- For Orbit Type, confirm that Sentinel Precise is selected.
- Under Authentication and Data Store, ensure that Username and Password are left empty.

- Click Run.
A new file with the .EOF extension is downloaded to the .SAFE folder. Next, you'll update the orbital information in the SAR image using the downloaded file in the Apply Orbit Correction tool.
- In the Geoprocessing pane, click the Back button. Search for and open the Apply Orbit Correction tool.

- For Input Radar Data, choose IW_manifest.
The Input Orbit File parameter populates automatically with the orbit file you downloaded.

- Click Run.
After the tool runs, the message Apply Orbit Correction completed appears. No new layer is created, but the original image is updated. Next, you'll perform orthorectification with the Apply Geometric Terrain Correction tool. Orthorectification is the process of correcting apparent changes in the position of ground objects caused by the perspective of the sensor view angle and variations in elevation on the ground. This process uses a digital elevation model (DEM) layer. You'll use the one that was provided in the Data_preparation folder.
- In the Geoprocessing pane, click the Back button. Search for and open the Apply Geometric Terrain Correction tool.

- For the Apply Geometric Terrain Correction tool, set the following parameters:
- For Input Radar Data, choose IW_manifest.
- Confirm that Output Radar Data is automatically populated.
- For Polarization Bands, check the VV and VH boxes.
- For DEM Raster, click the Browse button, browse to Folders > Data_preparation > DEM, select DEM.tif, and click OK.

- Click Run.
Note:
The Apply Geometric Terrain Correction tool may take about 10 minutes to run.
When the process is complete, the IW_manifest_GTC.crf output file appears.
You have applied orbit and geometric terrain correction to the image: all its pixels are now precisely located.
Create a 3-band composite and clip it
You'll continue to prepare the data by deriving a 3-band composite raster and clipping it to match your exact area of interest.
When using a deep learning pretrained model, you need to provide it with input that is similar to the data it was trained on. As you can read in the Water Body Extraction (SAR) - USA pretrained model documentation, the input expected is an 8-bit, 3-band Sentinel-1 C band SAR GRD VH polarization band raster.

This means the following:
- The input raster needs to have an 8-bit (unsigned) pixel depth.
- The input raster should be composed of three bands, each one containing a copy of the VH polarization band.
Note:
The Water Body Extraction (SAR) - USA pretrained model uses the DeepLab architecture, which expects a 3-band image as input. Since the VH SAR band is typically a good choice to detect water, it was decided, when training the model, to provide a 3-band composite where the VH band is repeated 3 times.
Your original Sentinel-1 dataset has a 16-bit unsigned pixel depth and it contains two polarization bands, VH and VV.
Tip:
If you want to find this information about the Sentinel-1 dataset yourself, in the Contents pane, right-click the IW_manifest layer and choose Properties. In the Properties window, click the Source tab and expand the Raster Information, Band Metadata, and Spatial Reference sections. Useful information includes the number of bands, band names (VV and VH), pixel depth, and coordinate system.
You'll derive an 8-bit 3-band composite using the Extract Bands raster function.
- On the ribbon, on the Imagery tab, in the Analysis group, click the Raster Functions button.

- In the Raster Functions pane, search for and open Extract Bands.

- In the Extract Bands raster function, on the Parameters tab, set the following parameters:
- For Raster, choose IW_manifest_GTC.crf.
- For Method, choose Band Names.
- For Band, choose VH three times.
- The Combination parameter will automatically populate with the expression VH VH VH.

- Click the General tab and choose the following settings:
- For Name, type Post_Flood_SAR_Composite.
- For Output Pixel Type, choose 8 Bit Unsigned.

- Click Create new layer.
The SAR composite is added to the map. Finally, you'll clip it to match your exact area of interest using the Extract by Mask tool. Reducing the extent will lower the amount of time needed to run the deep learning classification and change detection tools.
- In the Geoprocessing pane, click the Back button. Search for and open the Extract by Mask tool.

- For the Extract by Mask tool, set the following parameters:
- For Input raster, choose Post_Flood_SAR_Composite_manifest_GTC.crf.
- For Output raster, type Post_Flood_SAR_Composite_Clipped.

You'll draw your specific extent of interest.
- Under Analysis Extent, click the Draw Extent button.

- On the map, draw a rectangle that corresponds to your extent of interest.

Note:
For this tutorial, you can choose whatever extent you like.
In the Contents pane, the rectangle appears as a new layer named Extract by Mask Analysis Extent.
- In the Extract by Mask tool, for Input raster or feature mask data, choose Extract by Mask Analysis Extent.

- Optionally, click Environments. For Output Coordinate System, click the Select coordinate system button to choose a new coordinate system and obtain a reprojected output.
For example, WGS 1984 UTM Zone 15N was the projection chosen for the data you used earlier in this tutorial. Learn more about projections in the Choose the right projection tutorial.

- Click Run.
After a few moments, the output is added to the map.
- In the Contents pane, turn off all the layers except Post_Flood_SAR_Composite_Clipped, World Topographic Map, and World Hillshade.

The Post_Flood_SAR_Composite_Clipped layer has been prepared in the same manner as the Post_Flood_SAR_Composite image you used at the beginning of this tutorial. It is ready to be used as input to the deep learning classification and change detection workflow. Note that you would also need to prepare the pre-flood imagery following the same workflow.
- Press Ctrl+S to save the project.
In this tutorial, you mapped the flood in the St. Louis, Missouri, region in 2019. You extracted the water pixels in pre- and post-flood Sentinel-1 SAR imagery using a deep learning pretrained model. You then performed change detection between the two extracted water rasters to identify the flooded areas. Finally, you computed the total surface area affected by the flood in square kilometers. Optionally, you learned where to find data for your own area of interest and how to prepare it for analysis.
You can find more tutorials like these in the Try deep learning in ArcGIS series.


