Create a burn severity map
Image and raster data analysis provides valuable information for decision support in emergency management applications. Imagery can represent current information about a location and situation, and can be analyzed alongside historical imagery and other spatial information. Processing raster data is challenging because files are often large and complex. Additionally, data from different organizations and sources often needs to be shared and analyzed across the enterprise. The elastic distributed processing design of Raster Analytics provides an effective way to share and process large amounts of raster data quickly to support time-critical applications. Once optimized, you can save your processing chain, share it with members of your organization, and execute processing in your Raster Analytics deployment from ArcGIS Pro or the ArcGIS Enterprise's Map Viewer Classic.
In this module, you'll use raster function chains to derive a burn severity map, as it is important to know which areas had the most burn damage from the fire.
Note:
This tutorial uses Map Viewer Classic. Map Viewer Classic is the predecessor of Map Viewer. Some functionality is not yet available in Map Viewer. It is recommended that you use Map Viewer Classic for the following workflow until it is supported in a future release of Map Viewer.
Download the data and set the active portal
First, you'll download the data for the tutorial and then you'll set the active portal in ArcGIS Pro. This configuration step shares your account's licensing information with ArcGIS Pro and allows you to share processed data to your ArcGIS Enterprise for sharing.
- Download the LandslideData.zip file.
- On your C drive, create a folder called LandslideData.
- Go to the Downloads folder and extract the contents of the .ZIP file you downloaded into the LandslideData folder.
- Start ArcGIS Pro. If prompted, sign in using your licensed ArcGIS organizational account.
Note:
If you don't have access to ArcGIS Pro or an ArcGIS organizational account, see options for software access.
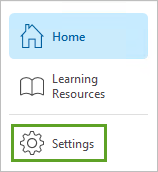
- Click Settings.
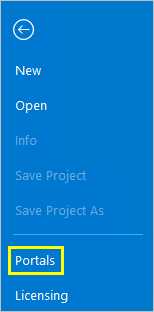
- Click Portals.
- If your portal is not listed, click Add Portal and enter your portal URL.
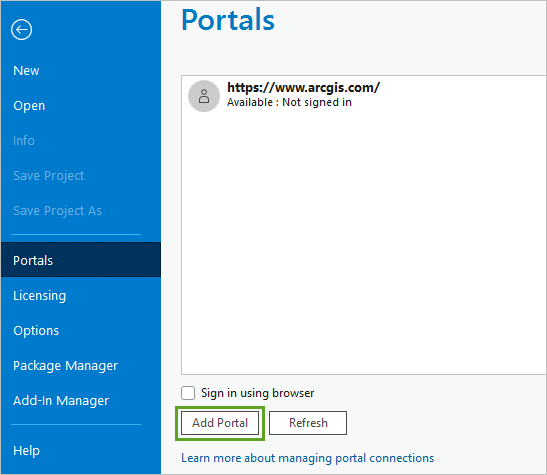
Once detected, the portal is added to the list.
- Right-click your portal and choose Sign in.
When you sign in, make sure you use an account that has the correct permissions to use the raster analysis functionality.
- Enter your username and password and click Sign in.
- Right-click the portal and choose Set as Active Portal.
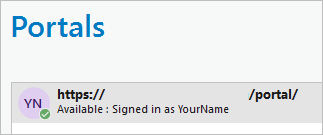
A green check mark appears next to your portal connection.
- Click the back arrow.

Now that you're connected to your Portal, you'll open a project template to begin your analysis.
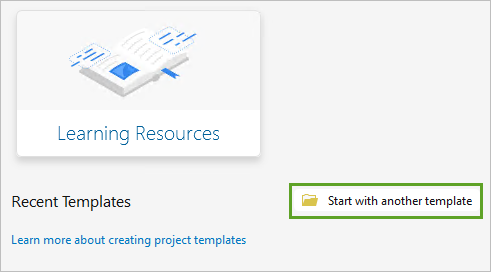
- Click Start with another template.
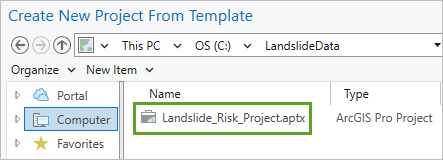
- Browse to C:\LandslideData on your Enterprise machine. Choose the project template file, Landslide_Risk_Project.aptx and click OK.
Tip:
If you can't locate this file, you can download and unzip LandslideData.zip to your local machine.
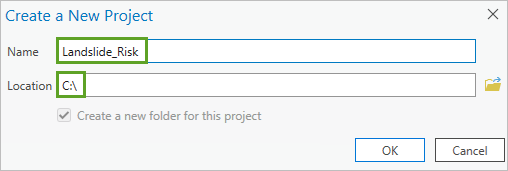
- In the New Project window, name your project Landslide_Risk and save it to the default location (in the Documents folder) on your computer. Click OK
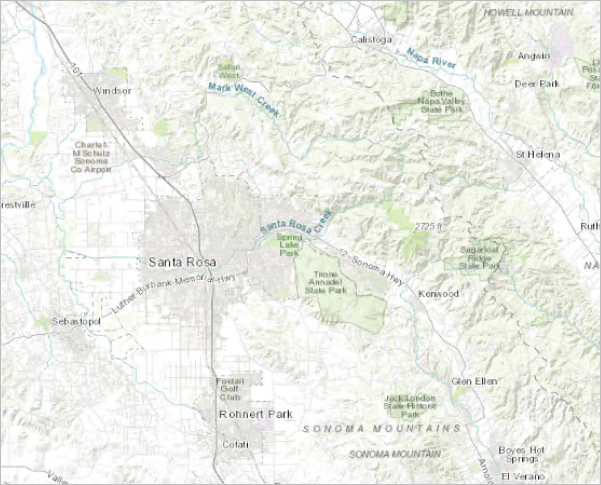
The new project opens with a map centered on Santa Rosa, California.
Next, you will make a folder connection to the LandslideData folder so you can quickly access the data.
- On the ribbon, click the Insert tab. In the Project group, click Add Folder.

The Add Folder Connection window appears.
- Browse to the LandslideData folder you created. Select it, and click OK.
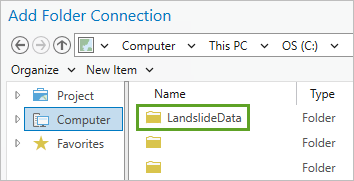
You have downloaded the data, set the active portal, opened a project template, and created a folder connection to the data. Now you are ready to perform analysis.
Analyze burn severity
Different types of vegetation and materials burn with different intensity depending on their composition, density, topography, wind, soil moisture, and other factors. Generally, higher burn intensities result in higher water repellence and higher potential for erosion from a rainfall event. Burn intensity, or severity, can be derived from multispectral imagery with a near-infrared and shortwave infrared band, such as Landsat 8 imagery. Using raster functions in a processing chain, you'll compute a burn ratio using Landsat 8 imagery acquired before and after the wildfires that took place around Santa Rosa, California in 2017.
To get started you'll add Landsat 8 imagery from before and after the fire, a digital elevation model, and landcover raster datasets.
- On the ribbon, click the Insert tab. In the Project group, click Add Folder.

The Add Folder Connection window appears.
- Browse to the LandslideData folder on drive C of your Enterprise machine. Select it, and click OK.

- On the ribbon, click the View tab. In the Windows group, choose Catalog Pane.

The Catalog pane appears.
- In the Catalog pane, on the Project tab, expand Folders, and expand the LandslideData folder. Select all the datasets inside except for Basins.tif and drag them onto the map.
Tip:
You can select multiple items at the same time by pressing the Ctrl key and clicking on the files.
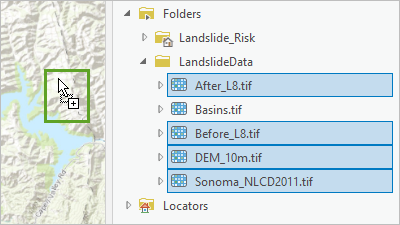
The data appears in the Contents pane and on the map.
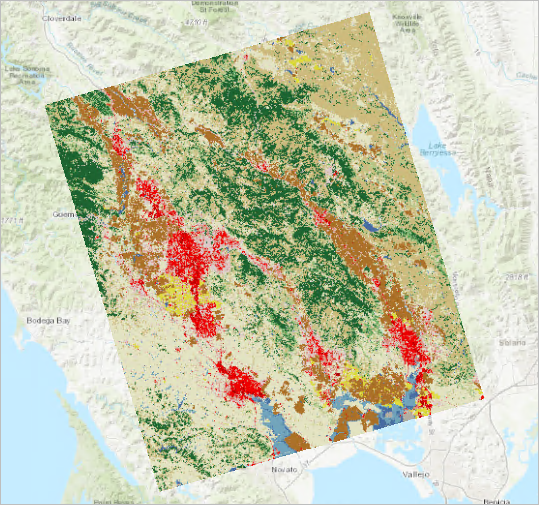
The data includes Landsat 8 imagery for before (Before_L8.tif) and after (After_L8.tif) the October 2017 wildfires in Napa and Sonoma counties. There are also two layers you'll use as inputs for your risk map. The DEM_30m.tif layer is a digital elevation model showing the terrain's elevation. The Sonoma_NLCD2011.tif layer is a portion of the National Landcover Dataset, which shows land use and predominant vegetation type.
- In the Contents pane, drag the After_L8.tif layer to the top of the list, and drag Before_L8.tif just below it. Turn off and collapse the Sonoma_NLCD2011.tif and DEM_30m.tif layers.
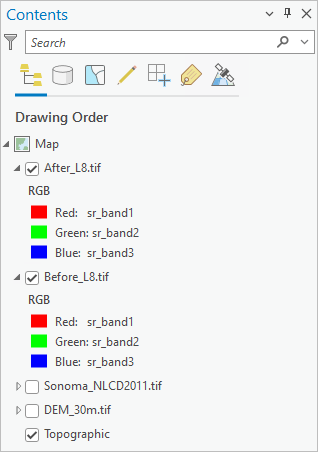
Currently, the Landsat imagery is displayed in the map using the red, green, and blue bands. To compare the burn scars, you'll display some of the imagery's multispectral bands.
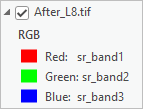
- Under After_L8.tif, right-click the red color chip and choose srband5.
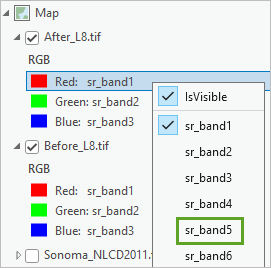
- For green, choose srband4, and for blue, choose srband3.
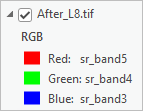
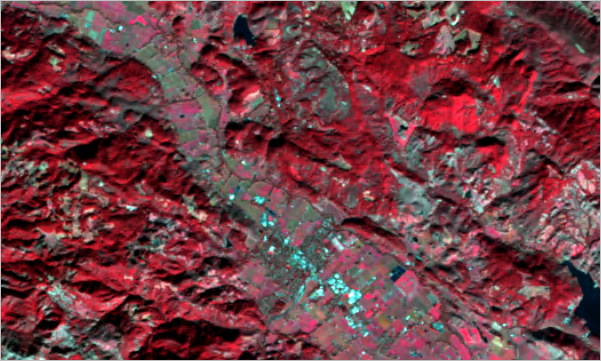
This band combination displays the Landsat 8 imagery bands in color infrared mode. Vegetation is shown in bright red. Nonvegetated features such as bare and urban areas are displayed in various shades of gray and blue.
- For the Before_L8.tif layer, set the following:
- Change the red color chip to srband5.
- Change the green color chip to srband4.
- Change the blue color chip to srband3.
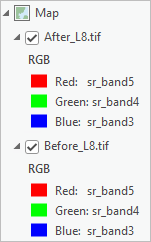
Next, you'll use the Swipe tool, to compare the before and after imagery of the wildfire.
- In the Contents pane, click After_L8.tif to select it.
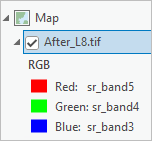
- On the ribbon, click the Raster Layer tab. In the Compare group, click the Swipe tool.
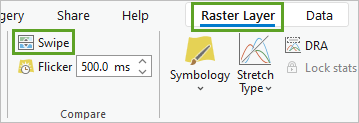
The pointer displays as an arrow in the map display.
- Click while swiping across the image in the map to compare the imagery before and after the wildfire.
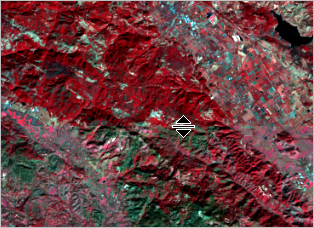
You can swipe vertically or horizontally. Notice that many areas that are red in Before_L8.tif are gray or green in After_L8.tif, indicating lost vegetation.
- On the ribbon, click the Map tab. In the Navigate group, click Explore.
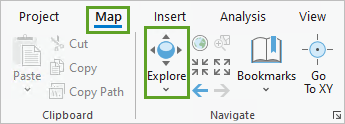
The pointer returns to normal. Now that all the data is on the map, you'll use raster functions to calculate the burn severity.
- On the ribbon, click the Imagery tab. In the Analysis group, choose Raster Functions.

The Raster Functions pane appears. On the System tab are categories of functions available for raster analysis. For this tutorial, two raster function templates, or RFTs, have been created for you. These custom function templates are listed under the Project tab.
- In the Raster Functions pane, click the Project tab.
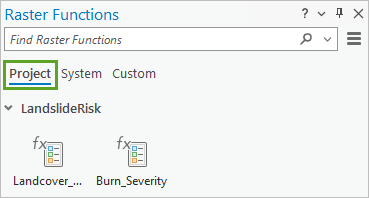
- Right-click Landcover_Remap, point to Move to, then point to Custom and click Custom1.
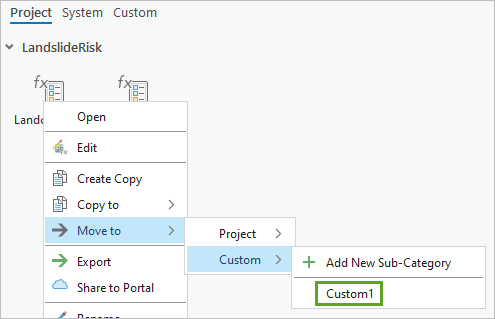
By moving these functions to a custom category, any edits you make to the RFTs will be saved if they are saved in the Function Editor. Changes made in the Project category will be lost if the project is not saved.
- Click the Project tab. Right-click Burn_Severity and move it to Custom1.
Next, you'll open and explore the Burn_Severity RFT.
- In the Custom tab, right-click the Burn_Severity template and choose Edit.
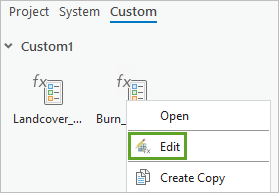
The Function Editor opens and displays the processing chain.
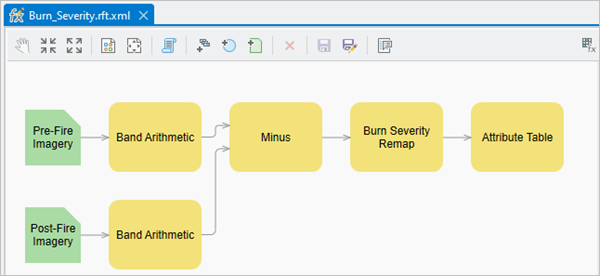
The Band Arithmetic functions turn the pixels of the imagery into expressions. The postfire imagery is subtracted from the prefire imagery and run through a remap function. The remap function categorizes the pixel values into five categories of burn severity. The breakpoints of the five burn severity values are obtained from a landscape assessment study (Key and Benson, 2005). The Attribute Table function in the processing chain assigns a color ramp to the burn severity map. This has already been created for you.
- Close the Burn Severity RFT in the Function Editor pane.

Now that you understand how this raster function works, you'll use it to calculate the burn severity of the project area.
- In the Raster Functions pane, click the Burn_Severity template.
The Burn_Severity Properties raster function appears.
- For Pre-Fire Imagery, choose Before_L8.tif, and for Post-Fire Imagery, choose After_L8.tif.
- Make sure Output Layer Type is set to Raster Layer and click Create new layer.
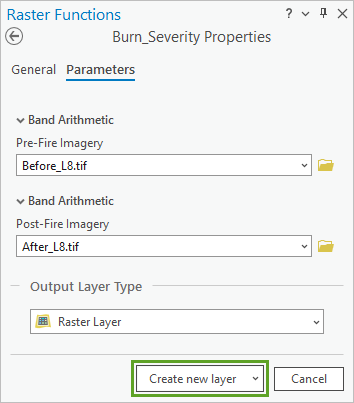
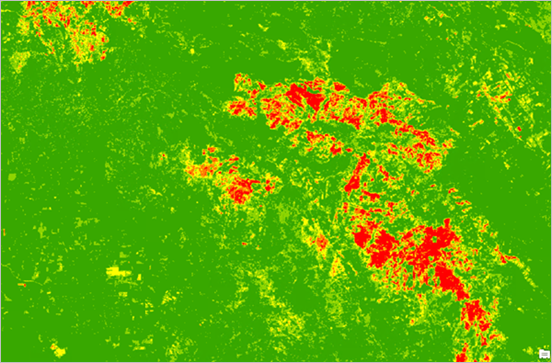
The processing may take a few minutes to complete. When finished, the resulting layer is displayed in the map and listed in the Contents pane. Raster functions are temporary in nature—calculations are performed on the fly, or in real time as you move on the map, and are not saved automatically. Burn severity is computed dynamically in the display as you navigate around the layer.
- On the Quick Access Toolbar, click the Save Project button.

Now that you've seen what a raster function can do, you'll learn how to build a raster function template in the next section to create a slope index map.
Create a slope index map
Build the slope raster function template
The slope map is a critical layer in determining slope stability. Slope steepness is derived from a digital elevation model (DEM). The steeper the slope, the more prone it is to slipping, especially during rainfall after stabilizing vegetation has been burned away. Next, you'll build and save a raster function template to calculate percent slope and use it to create a steepness index.
- On the ribbon, click the Imagery tab. In the Analysis group, click Function Editor.
The Function Editor pane docks at the bottom of the map window.
- In the Raster Functions pane, click the System tab. Expand the Surface group.
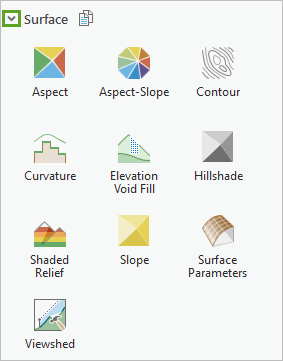
- Drag the Slope function into the Function Editor pane.
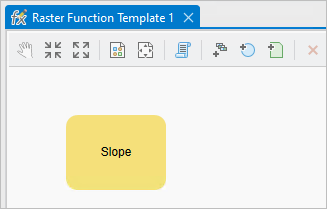
- In the Function Editor pane, on the ribbon, click Add Raster Variable.
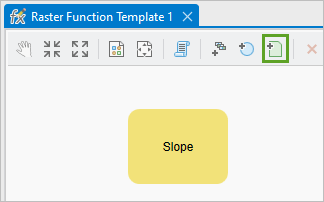
A green box titled Raster is added to the Function Editor pane.
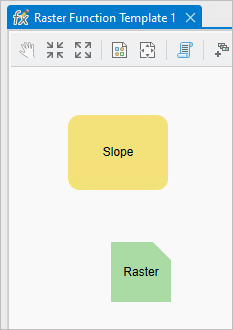
- Select the Raster box and position it to the left of the Slope function box.
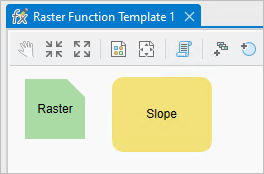
The Raster box will define the input dataset for the Slope function.
- Point to the Raster box to see the Out parameter displayed. Click Out and drag to connect the raster element (Out parameter) to the Slope function (DEM parameter).
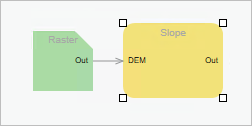
- Right-click Raster and click Rename. Type Input DEM and press Enter.
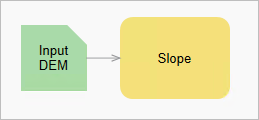
- Double-click the Slope function. In the Slope Properties window, click the Variables tab. For DEM, check the IsPublic field.
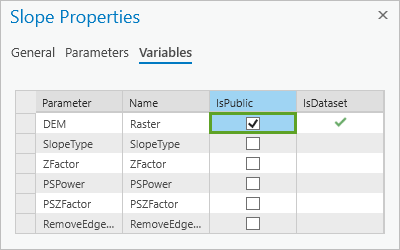
The IsPublic option allows you to alter the input data in a later tool process.
- Click OK.
Your raster function will take an input digital elevation model and calculate its slope. The next function, Remap, will classify the slope into 5 categories of steepness.
- In the Raster Functions pane, on the System tab, search for Remap.
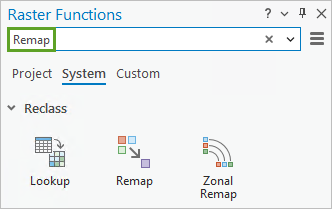
- Drag the Remap function into the Function Editor pane to the right of the Slope function.

- Connect Slope to Remap by setting the Out of Slope to the Raster input for Remap.

Next, you'll set the inputs for the remap to index the slopes (in units of degrees) into five categories.
- Double-click the Remap function. In the Remap Properties window, click the first box under the Minimum heading and type 0. For Maximum, type 5, and for Output, type 1.
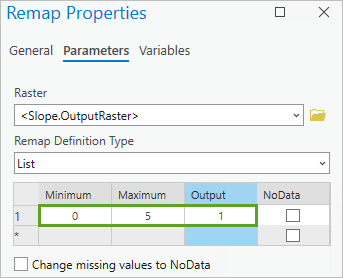
- Set additional categories with the following values:
Minimum Maximum Output 2
5
15
2
3
15
25
3
4
25
35
4
5
35
91
5
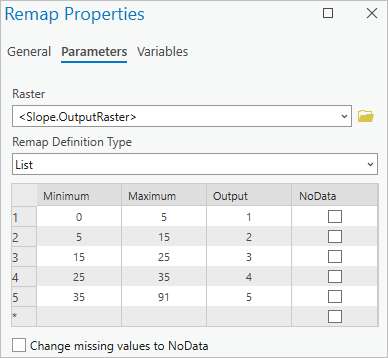
- Click the General tab. For the Output Pixel Type, in the drop-down menu choose 8 Bit Signed.
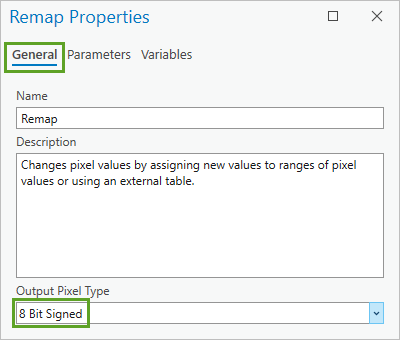
The Attribute table tool, which will be the next tool you add, can only take input rasters that are 8 bit. Hence, you set the Output pixel Type to 8 Bit Signed.
- Click OK.
- Right-click the Remap function and choose Rename. Type Slope Remap and press Enter.
This will help distinguish between functions later in this tutorial when you string several raster function chains together.
- In the Raster Functions pane, search for the Attribute Table function and drag it into the Function Editor pane to the right of Slope Remap.

- Connect the output from the Remap function to the input (Raster) of the Attribute Table function.

- Double-click the Attribute Table function and set Table Type to Manual.
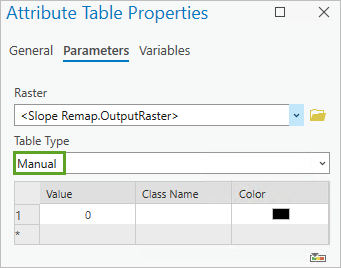
- Under the blank table, click the Generate button.
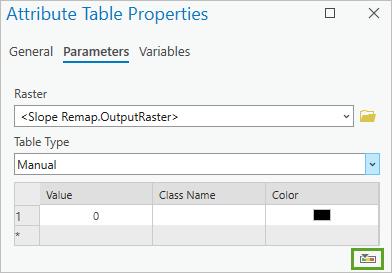
- For Maximum Value, choose 5. Click OK.
Five rows are added with values 1 to 5 and a default green-to-red color scheme.
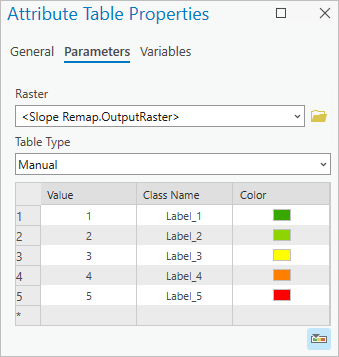
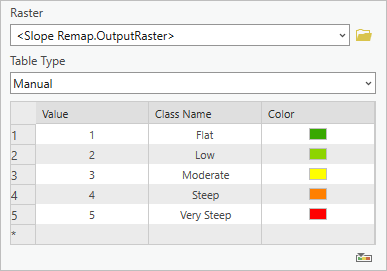
- Click Class Name for each row and assign the slope classes as follows:
Value Class Name 1
Flat
2
Low
3
Moderate
4
Steep
5
Very Steep
- Click OK.
Now that your raster function template is complete, you'll save it.
Save and run the slope function
You'll save the raster function template to your project and run it to create the slope index layer.
- In the Function Editor pane, click Save As.

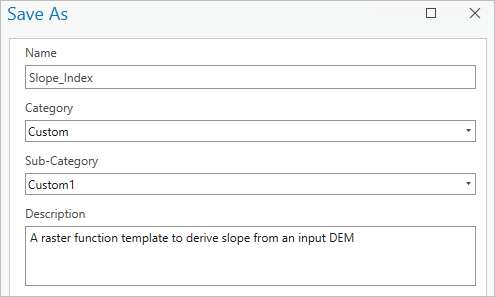
The Save As window appears.
- In the Save As window, for Name, type Slope_Index.
- Make sure Category is set to Custom and Sub-Category is set to Custom1.
- For Description, type A raster function template to derive slope
from an input DEM.
- Click OK.
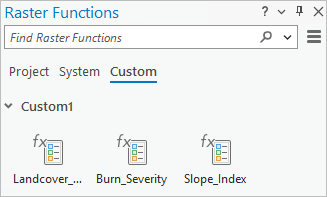
Your Slope_Index raster function template (RFT) now appears in the Custom category in the Raster Functions pane.
Tip:
You may need to clear the search bar before you can see the RFT.
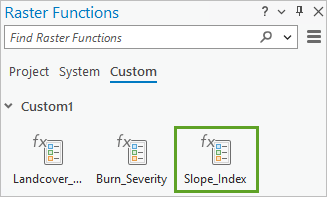
- In the Raster Functions pane, click Slope_Index.
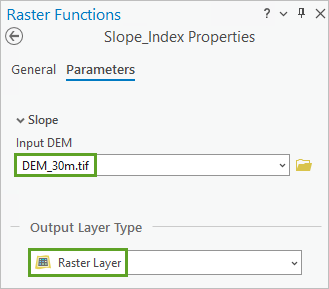
- For Input DEM, choose DEM_30m.tif. Make sure Output Layer Type is set to Raster Layer.
- Click Create new layer.
When it is finished processing, the layer displays on the map and is listed in the Contents pane with the name Slope_Index_DEM_30m.tif.
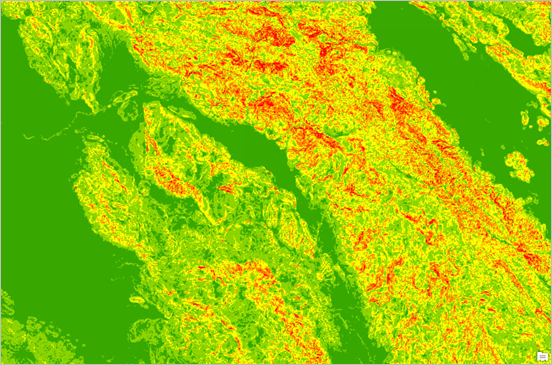
- Close the Slope_Index RFT in the Function Editor pane and save your project.
Now that you have a function to classify slope, you'll combine several RFTs and criteria together to create a landslide risk map.
Create a landslide risk map
Build the landslide risk raster function
The landslide risk calculation combines the two variables you just worked with: burn severity and slope. It also includes land-cover, which is also important to landslide risk. Vegetation stabilizes slopes via root systems. Wildfire can wipe out much of the stabilizing vegetation. Some types of vegetation, especially species of chaparral, have adapted to wildfire, and the root systems are especially deep underground to survive fires. Land-cover has already been indexed into five categories for you depending on its stabilizing effect on slopes. To perform the landslide risk calculation, you'll add the three raster function templates into a chain that will be processed on your ArcGIS Enterprise deployment.
- On the ribbon, on the Imagery tab, click Function Editor.
The Function Editor pane appears.
- In the Raster Functions pane, press the Ctrl key and select the Landcover_Remap, Burn_Severity, and Slope_Index RFTs. Drag them onto the Function Editor canvas.
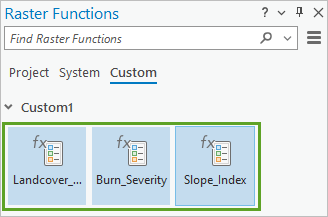
By default, the RFTs cluster together. You'll separate them so that you can more easily connect their outputs.

- Click and hold to draw a box around the Slope_Index functions, and then drag the entire group so that it's below the Burn_Severity RFT.

Tip:
The green input boxes mark the beginning of each function chain. The Slope_Index RFT starts with the green Input DEM box.
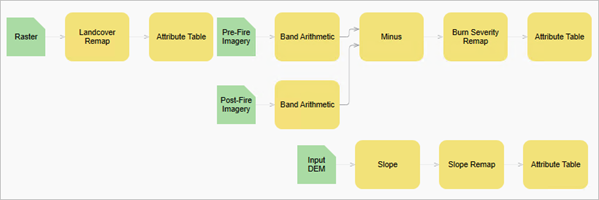
- Drag the Landcover_Remap RFT below Slope_Index RFT.
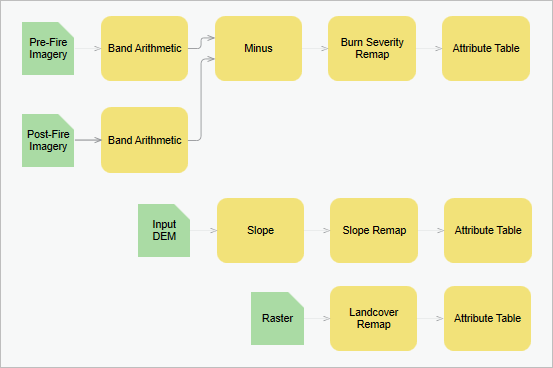
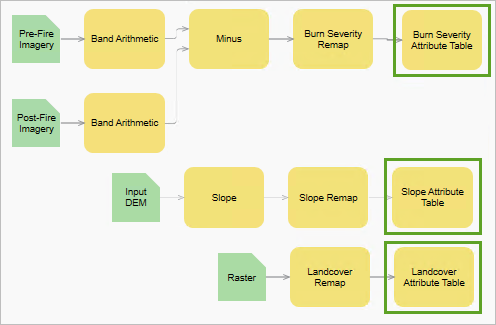
- Right-click each Attribute Table function and rename it to match the corresponding Remap function.
Their new names should be Burn Severity Attribute Table, Slope Attribute Table, and Landcover Attribute Table.
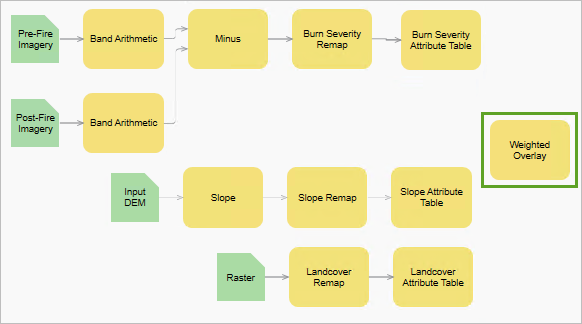
- In the Raster Functions pane, click the System tab and search for the Weighted Overlay function. Drag it into the Function Editor pane to the right of the other three RFTs.
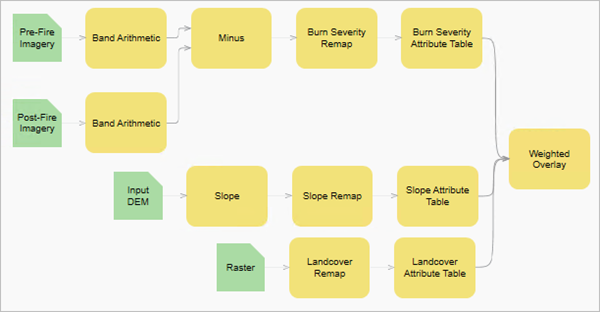
- Connect the three Attribute Table outputs to the input parameter of the Weighted Overlay function.
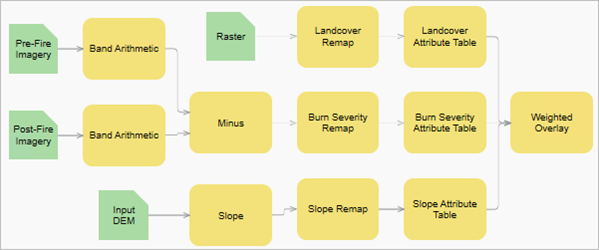
- In the Function Editor pane, click the Auto Layout button.

The RFTs are arranged compactly.
- Double-click the Weighted Overlay function.
The Weighted Overlay Properties window appears. Inside the Weighted Overlay Table you can assign weights in percentages to each raster.
- In the Weighted Overlay Table, in the cell next to <Burn Severity Attribute Table.OutputRaster>, type 30. For the <Slope Remap Attribute Table.OutputRaster> layer, assign 55 percent. For the <Landcover Remap Attribute Table.OutputRaster> layer, assign 15 percent.
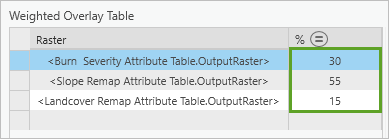
These hazard weights are loosely based on research done by the USGS for its National Landslide Hazards Program.
The Remap Table is still empty. Since all three layers have the same number of index categories, you'll map each of them one-to-one.
- In the Weighted Overlay Table, click the <Burn Severity Attribute Table.OutputRaster> layer. In the Remap Table, under Value, click NODATA to edit the attribute field and type 1. Under Scale, click NODATA and choose 1.

- In the Remap Table, double-click the empty row at the bottom of the Value column and type 2. For Scale, choose 2.
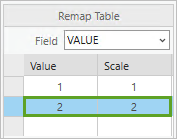
- Repeat the previous step to add rows 1 through 5 for all three rasters in the Weighted Overlay Table.
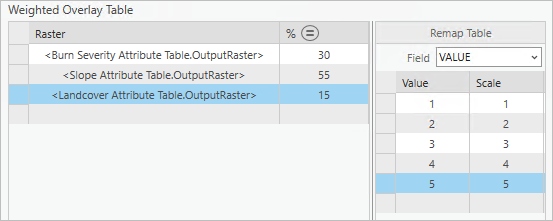
- Click OK.
- In the Raster Functions pane, on the System tab, search for the Attribute Table function and drag it into the Function Editor pane to the right of the Weighted Overlay function.
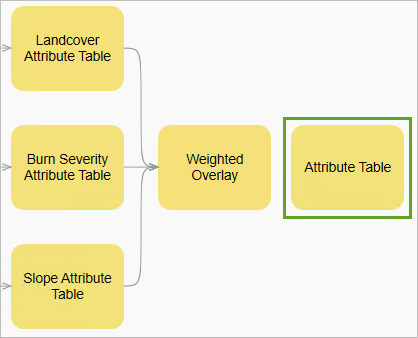
- Connect the output from the Weighted Overlay function to the input of the Attribute Table function.
- Double-click the Attribute Table function. In the Attribute Table Properties window, for Table Type, choose Manual.
- Under the blank table, click the Generate button and set Maximum Value to 5. Click OK.
Five rows are added with values 1 through 5 and a default green to red color scheme.
- Click Class Name for each row and assign them the values as following:
Value Class Name 1
Low
2
Medium
3
High
4
Very High
5
Extreme
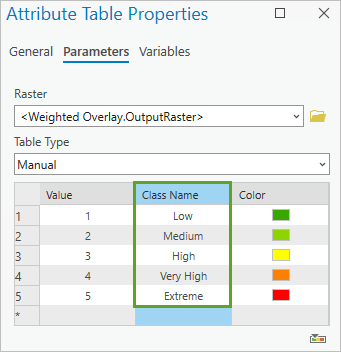
- Click OK to close the Attribute Table Properties window.
The landslide risk raster function template is complete.
Save and run the landslide risk raster function
Next, you will save the raster function template and run it to create the landslide risk layer. This template considers slope, burn severity, and landcover as the primary criteria to determine landslide risk.
- In the Function Editor, click Save As.
- In the Save As window, for Name, type Landslide_Risk. Make sure Category is set to Custom and Sub-Category is set to Custom1.
- For Description, type Raster Function Template to calculate landslide risk based on wildfire burn severity, slope, and landcover.
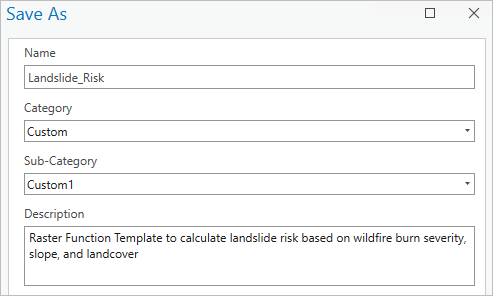
- Click OK and close the Function Editor pane.
Your raster function is complete. You'll now run it using distributed raster analytics.
- In the Raster Functions pane, clear your search.

- If necessary, click the Custom tab. Click Landslide_Risk.
The Landslide_Risk raster function appears.
- Fill in the input parameters as follows:
- For Pre-Fire Imagery, choose Before_L8.tif.
- For Post-Fire Imagery, choose After_L8.tif.
- For Slope Input DEM, choose DEM_30m.tif.
- For Landcover Remap Raster, choose Sonoma_NLCD2011.tif.
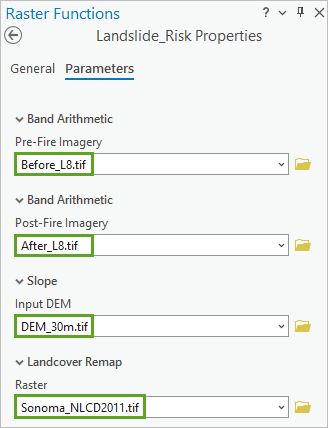
- For Output Layer Type, choose Web Imagery Layer and click Next.
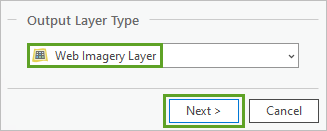
Note:
If you don't see an option to set your output to a Web Imagery Layer, talk to your administrator to make sure that the Raster Analysis server is set up properly and operational.
The Output Generation pane appears and allows you to set the properties for the web layer you'll create in your Enterprise.
- For Name, type Landslide_Risk. For Description, type This web layer shows a landslide risk estimate for Sonoma County, CA.
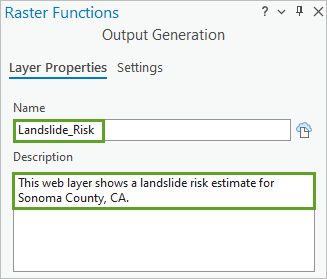
- For Tags, type Sonoma County, landslide, risk, wildfire. Press Enter.
Four separate tags are added.
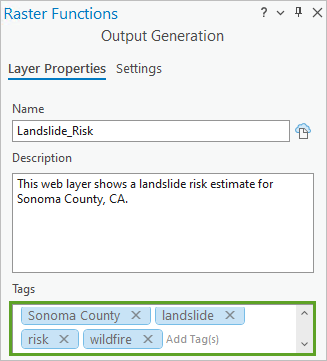
- Click Run.
The processing chain is submitted to your Enterprise deployment for distributed processing. A message appears, informing you that the process was submitted.

- Click the Raster Functions notification to view the status of your RFT.
The History pane appears and the Raster Functions tab is selected. Any raster functions that you have previously used will be listed here.
Note:
If the Raster Functions notification disappeared, there is another method to access the status of your raster processing. On the ribbon, click the Analysis tab. In the Geoprocessing group, click History. In the History pane, click the Raster Functions tab.
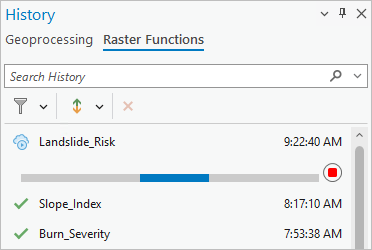
You'll see a green check mark next to the raster function once the process has successfully completed.
You have created the landslide risk layer using raster functions and shared it as a web imagery layer to your portal. Later, you will use this layer in Map Viewer Classic to perform raster analysis.
Summarize landslide risk by watershed basin
Share the basins layer to your portal
Although the landslide risk map is useful, you want to go further to break down the areas that are most at risk. Because landslide risk is impacted by precipitation patterns and watershed characteristics, you'll summarize risk by watershed basins within the study area. First, you'll publish the watershed basin layer to your Portal. Then, you'll use the landslide risk dataset produced in the previous section to summarize risk per subbasin.
- In the Catalog pane, click the Project tab and browse to the LandslideData folder connection.
- Right-click Basins.tif and choose Share as Web Layer.
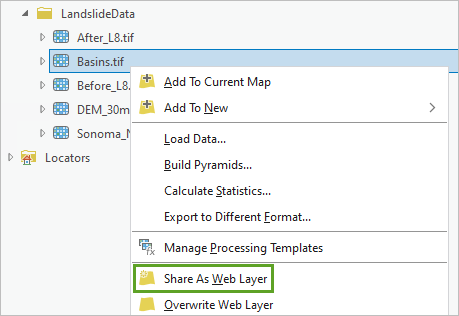
The Share As Web Layer pane appears. This pane allows you to name and configure this raster dataset when you publish it to your Portal.
- Under Item Details, set the following:
- For Name, type Basins.
- For Summary, type Watershed subbasins in Napa and Sonoma counties, California.
- For Tags, type watershed, basin, California and press Enter.
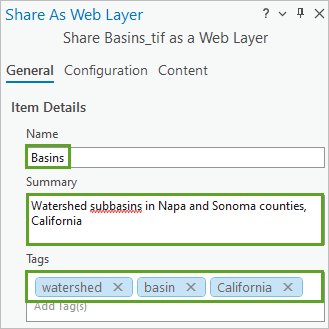
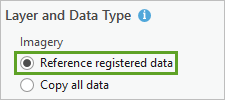
Next, you'll ensure that this raster dataset is referenced from the LandslideData folder and not saved as a copy to the Portal.
- Under Layer and Data Type, make sure Reference registered data is selected.
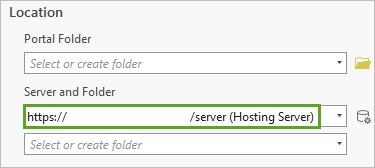
- Under Location, for Server and Folder, choose the location where you will store the Basins layer.
Note:
Your server location is dependent on your set up and may vary from the example shown in the image.
- Click Analyze.
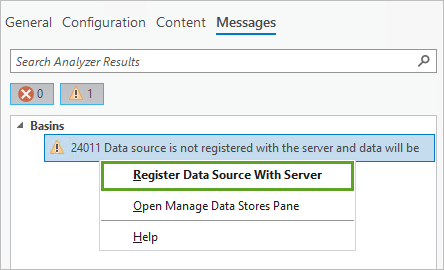
Most likely, you will get an error warning stating that the data source is not registered with the server. This is an expected result. If you didn't get an error or warning, then you can proceed to step 12 because you already have a registered data store.
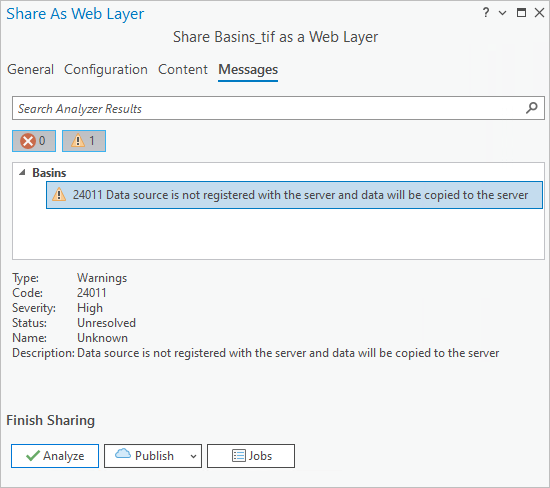
Note:
When you publish web services to Enterprise and choose to reference registered data, the data source must be registered with ArcGIS Server. This registration allows the server to access your data and use it as the source for web layers. Creating a data store is the key to making your data accessible to the server. A data store can be any location—enterprise databases, folders, cloud stores, or NoSQL databases—that houses the data you want to use. After registering the data with the server, the published web service establishes a direct connection to the data source. This connection ensures that the web services reference the data in the data store without duplicating it.
Usually, you can proceed with publishing when you have a warning, but in this case, it is recommended to register the data with the server to ensure you are sharing a reference to the data and not a copy of it.
- Right-click the warning and choose Register Data Source With Server.
- In the Add data store window, for Title, type BasinsDS.
- For Tags, type basins and data store.
- For Select the servers to which you want to add your data store, click the check box for your server and click Validate.

Note:
To learn more about registering and managing data stores, see Managed registered data stores.
- Click Create.

Once you create the data store, the data is registered with the server and a green check mark appears next to the warning. Now you can publish the web layer.
- Click Publish.
- Click the Manage the web layer link.
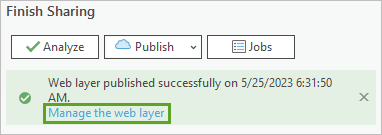
The item details page for your Basins layer appears.
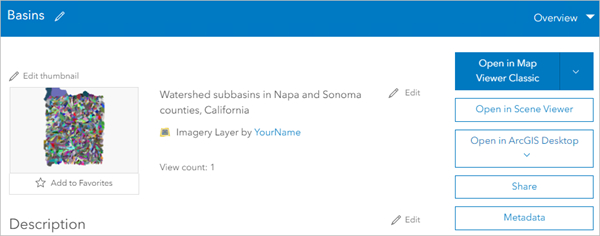
- On the ribbon, click the Content tab.

In sharing the web layer, you created two items in your portal; an imagery layer and a data store. The data store was created when you registered the data source with the server and was required for sharing to the portal.
Perform raster analysis
You have shared the Basins layer to your portal and can now include it in your analysis. You will use a raster analysis tool called Summarize Within to summarize the landslide risk based on the watershed subbasin characteristics.
- Click the Basins layer to return to its item details page.
- Click the down arrow next to Open in Map Viewer and choose Open in Map Viewer Classic.
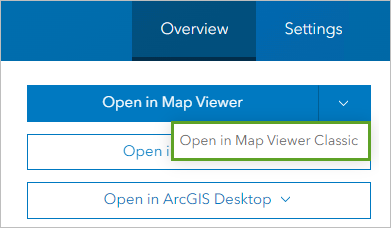
The Map Viewer Classic opens.
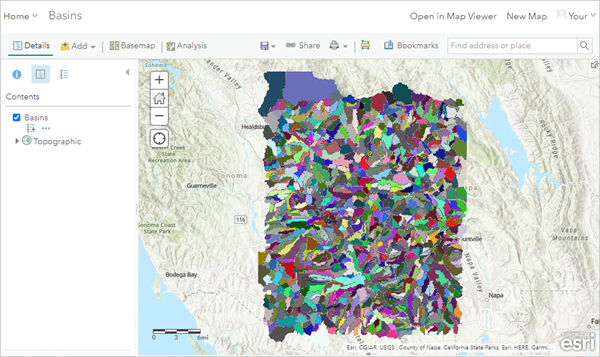
Next, you'll add the Landslide_Risk dataset to the map.
- On the ribbon, click Add and choose Search for Layers.
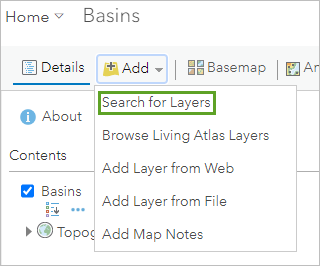
- Confirm that the search is set to My Content. Find your Landslide_Risk layer, and click the Add button.
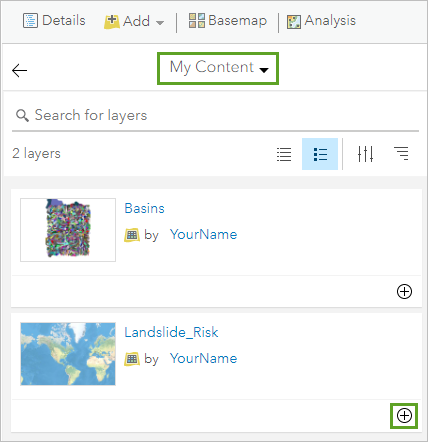
The Landslide_Risk layer is added to the map.
Note:
If the landslide risk layer fails to load in the map, you may need to wait a few minutes for processing to complete and try again.
Now that you have a layer for basins and for risk, you'll calculate the average risk per basin with the Summarize Raster Within tool.
- On the ribbon, click Analysis and choose Raster Analysis.
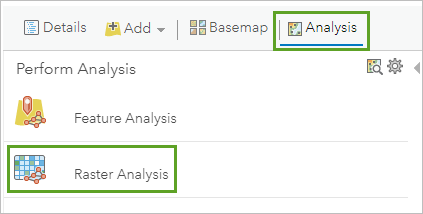
- Expand Summarize Data, and click the Summarize Raster Within tool.
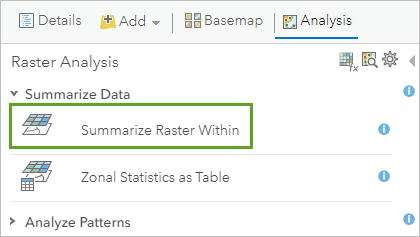
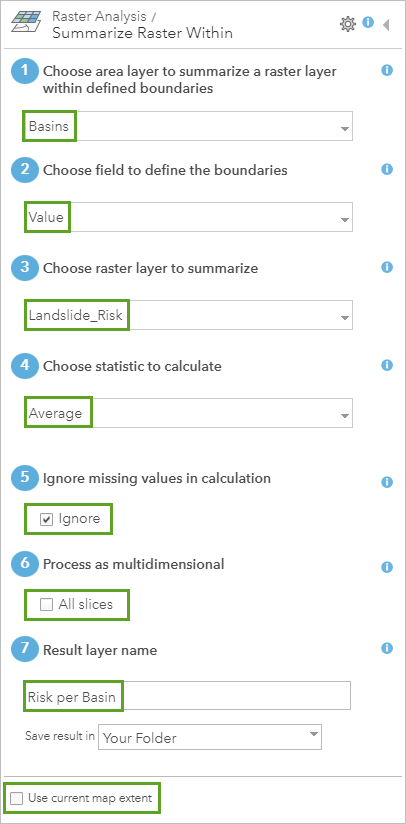
- For the Summarize Raster Within tool, fill out the following parameters:
- For Choose area layer to summarize a raster layer within defined boundaries, choose Basins.
- For Choose field to define the boundaries, choose Value.
- For Choose raster layer to summarize, choose Landslide_Risk.
- For Choose statistic to calculate, choose Average.
- For Ignore missing values in calculation, check the box next to Ignore.
- For Process as multidimensional, uncheck the box next to All slices.
- For Result layer name, type Risk per Basin.
- Uncheck the box next to Use current map extent.
- Click Run Analysis.
When the analysis finishes, a dataset that shows the average risk per watershed is added to the map.
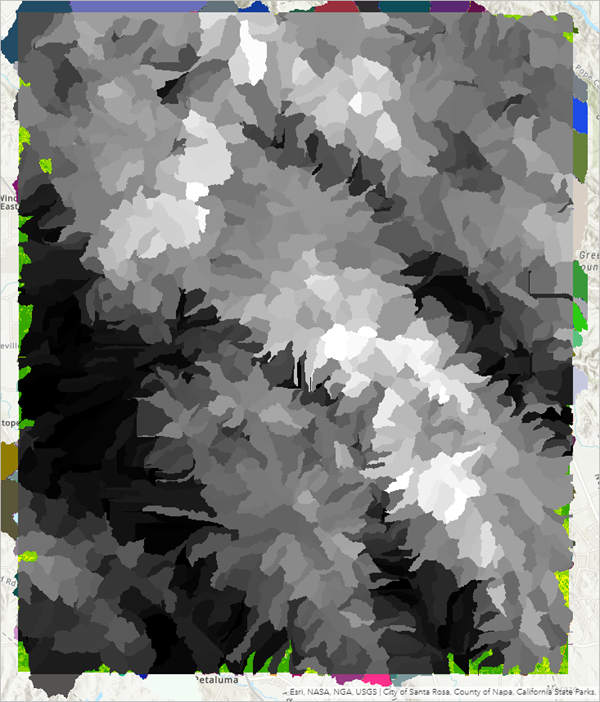
The areas in white and light gray have higher landslide risk values. This is based on the risk you calculated using the raster function template with the weighted inputs of slope, burn severity, and land-cover. However, the current results are difficult to see with this symbology. After you save the map, you'll update the symbology. This will make it easier to understand the results from your analysis.
- On the ribbon, click Save and choose Save As.
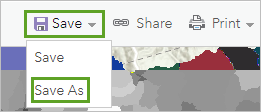
The Save Map window appears.
- In the Save Map window, set the following:
- For Title, type Landslide Risk per Basin (Sonoma and Napa).
- For Tags, type landslide, risk, wildfire and press Enter.
- For Summary, type Landslide risk per basin in Sonoma and Napa counties, based on wildfire burn severity, slope, and landcover.
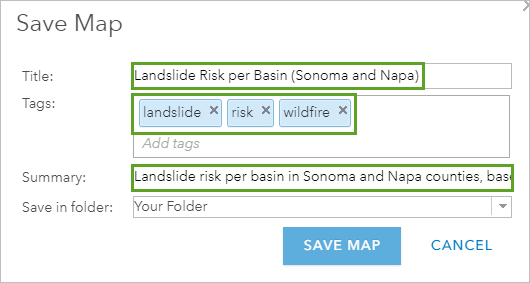
- Click Save Map.
Your web map is now saved in your content and you can access it for further analysis or include it in other apps.
Note:
To learn more about creating apps, see the tutorial Create an app.
In this tutorial, you created raster function templates to process criteria layers, have shared imagery layers to your Portal, and summarized risk by watershed subbasin using a raster analysis tool in Map Viewer Classic. You now have a final result layer that illustrates areas with the highest landslide risk that you can include in other web maps or apps and share them across your organization.
You can find more tutorials in the tutorial gallery.

