Solve a spatial problem
Video
This tutorial is also available as a video.
Open and save the map
Start by opening Map Viewer and searching for layers to use in your analysis.
- Sign in to your ArcGIS Enterprise portal using a named user account.
- Click Map on the toolbar to open Map Viewer.
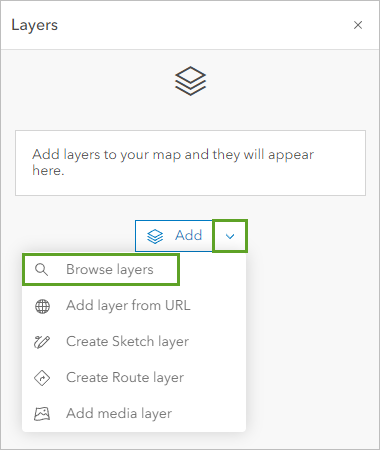
- In Map Viewer, for Add, click the drop-down arrow and choose Browse layers.
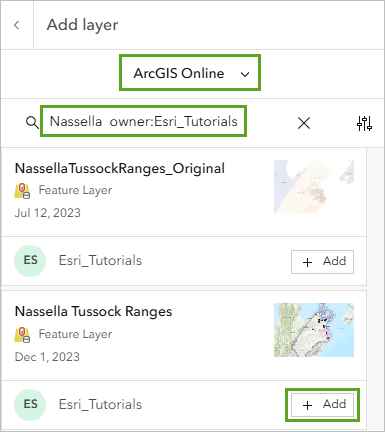
- In the Add layer pane, for My content, click the drop-down menu and choose ArcGIS Online. In the Search dialog box, type or copy and paste Nassella owner:Esri_Tutorials. For the Nassella Tussock Ranges result by Esr_Tutorials created on December 1, 2023, click the Add button.
Map Viewer opens to New Zealand.
- Once the layer is added, click the back arrow to return to the Layers pane.
- Zoom to the campground features clustered in the Marlborough Region, if necessary.
Commercial campgrounds are displayed, along with the known distribution of Nassella tussock. The Nassella Tussock Range layer does not represent the density of the plant at a given location. A marked area may be heavily infested or it may have only scattered plants.
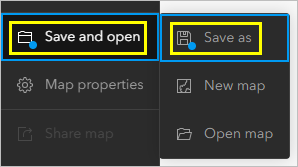
- On the Contents (dark) toolbar, click Save and open and choose Save as.
Note:
At the bottom of each toolbar, you can click the Expand button to display the name of the button, rather than just the icon. The steps in this tutorial show the toolbars collapsed, or without their names displayed.
- Rename the map Nassella Tussock Range and add your name or initials at the end.
Using your name in the title will ensure that the map title is unique in your organization.
- Click Save.
Explore the Analysis pane
To carry out the analysis, you'll run tools from the Analysis pane. First, you'll see how these tools are organized in Map Viewer.
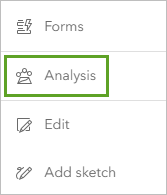
- On the Settings (light) toolbar, click Analysis.
Note:
If you do not see the Analysis button in Map Viewer, contact your ArcGIS administrator. You may not have the privileges required to perform analysis.
Learn more about licensing requirements for spatial analysis.
The Analysis pane appears. From the Home tab, you can access Tools or History. The Tools tab lists all available analysis tools, and the History tab tracks which spatial analysis tools have been run in a web map, including successful and unsuccessful runs.
- Click Tools.
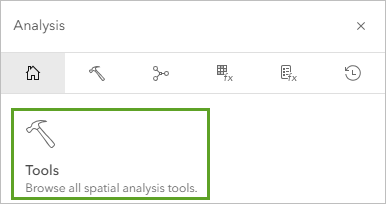
The tools are grouped into categories based on the type of analysis they perform. The Summarize data tools are displayed by default.
- Point to the Summarize Nearby tool.
A pop-up message provides a description of the tool.
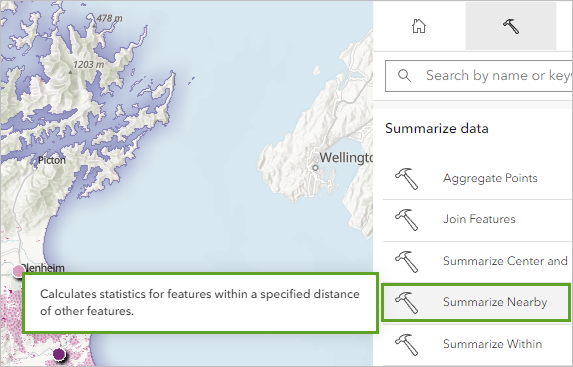
The Summarize Nearby tool calculates statistics for features within a specified distance of other features. You will use it to calculate how much Nassella tussock lies near campgrounds.
In this section, you opened a web map and explored an analysis tool that you will use. Next, you will use the tool to summarize Nassella tussock near campgrounds.
Quantify Nassella tussock near campgrounds
You want to find out how much Nassella tussock lies near campgrounds. Why does that matter? For public education, it may be useful to provide campgrounds with a bulletin on whether Nassella tussock has been found in the area, and, if it has been found, whether or not it is widespread. For researchers, a quantitative measurement is a baseline for comparison in coming years.
- In the Tools pane, click the Summarize Nearby tool.
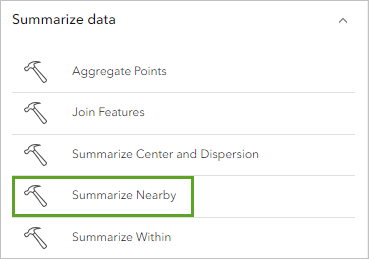
One of the functions of Summarize Nearby is to calculate how much area from one layer falls within a distance of another layer—this is what you want to do for your analysis. The first parameter is the features that will be summarized. The second parameter determines the feature around which the distance will be calculated.
- In the Summarize Nearby tool, enter the following parameters:
- For Input features, click Layer and choose Nassella Tussock Ranges - Nassella Tussock Range.
- For Nearby layer, click Layer and choose Nassella Tussock Ranges - Commercial Campgrounds.
- For Measurement type, ensure Line distance is selected.
- For Measurement values, type 1.5 and for Units, choose Kilometers.
- Ensure Return output as bounding areas is checked.
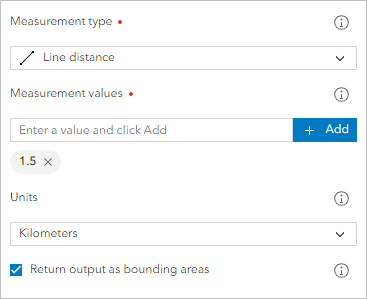
You can also choose to calculate statistics for the input layer. In this case, you'll summarize the area of Nassella tussock that is found within 1.5 kilometers of each campground.
- In the Calculate statistics group, ensure Include summarized geometry of features is enabled.
- Change Summarized area units to Hectares.
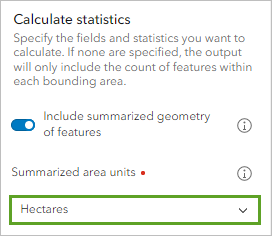
A hectare is a metric unit of area equal to 10,000 square meters or roughly two and a half acres.
- In the Result layer group, change Output name to Tussock_Near_Campgrounds followed by your name or initials.
- Click Run.
When the tool completes successfully, the Tussock_Near_Campgrounds layer appears on the map.
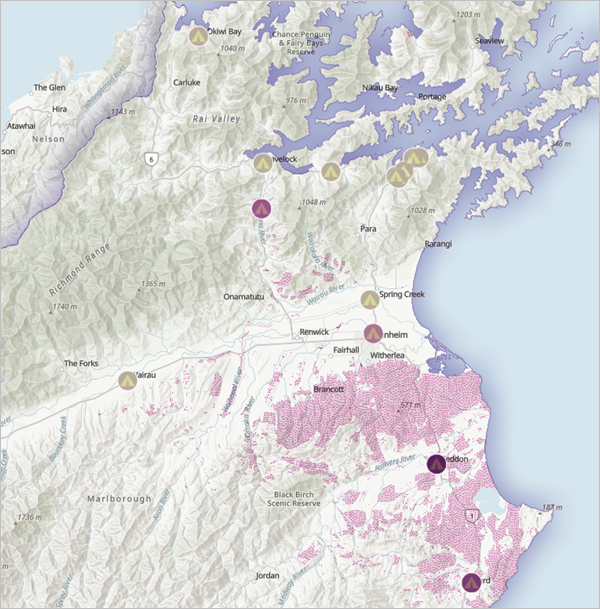
The features are symbolized with graduated colors, showing campgrounds with the least Nassella tussock in beige and campgrounds with the most Nassella tussock in dark purple. In the next section, you will change the style of the symbols to make them more visible.
Update the map symbols
You ran the Summarize Nearby tool to calculate the total area containing Nassella tussock plants within 1.5 kilometers of a campground. Next, you will update the symbol style and filter the results.
- If necessary, on the Contents toolbar, click the Layers button to open the Layers pane.
- Click the Tussock_Near_Campgrounds layer to select it.
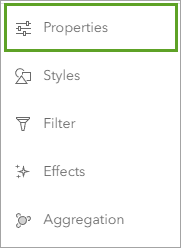
- On the Settings toolbar, click Properties.
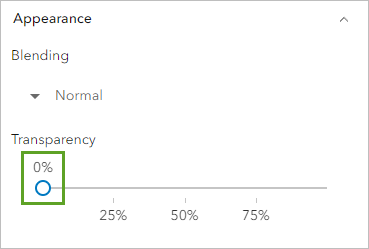
- In the Appearance section, for Transparency, drag the slider all the way to left to set it to 0.
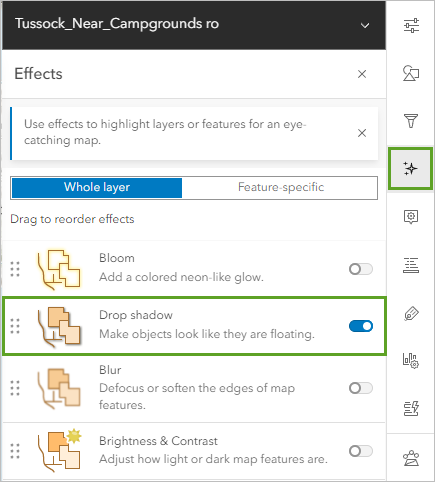
- On the Settings toolbar, click the Effects button and click Drop shadow to enable it.
All the campground summaries are symbolized, but you know from viewing the Nassella Tussock Range layer that the campgrounds don't all have Nassella tussock growing near them. You'll filter the layer to show only campgrounds with the invasive weed.
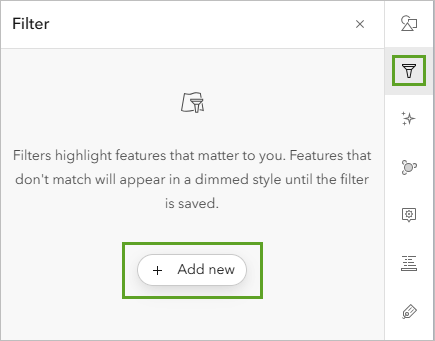
- On the Settings toolbar, click the Filter button and click Add new.
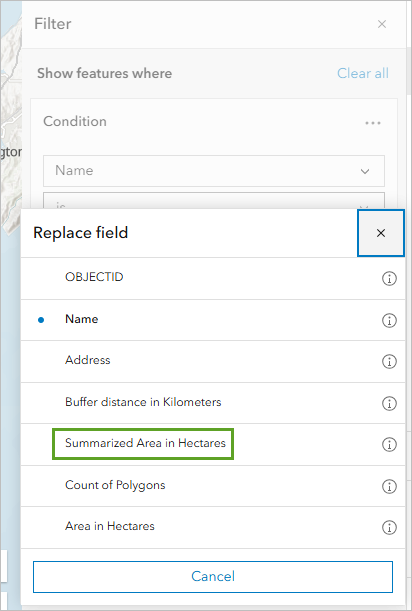
- For Condition, click the Name drop-down menu and choose Summarized Area in Hectares.
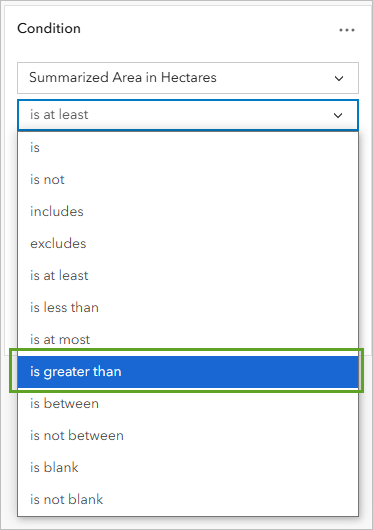
- Click the second drop-down menu and choose is greater than.
- For the box containing the numeric value, delete the existing number and type 0.
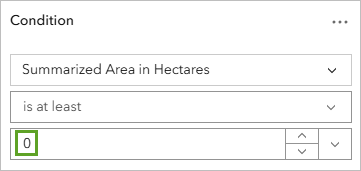
The full expression now reads Summarized Area in Hectares is greater than 0.
- Click Save to save the filter.
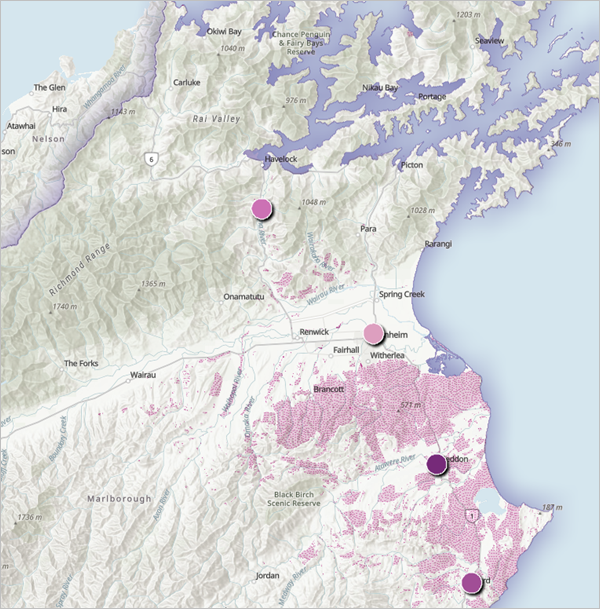
The beige features are removed from the map. You will also turn off the Commercial Campgrounds layer.
- Expand the Nassella Tussock Ranges layer. For Commercial Campgrounds, click Visibility to turn off the layer.
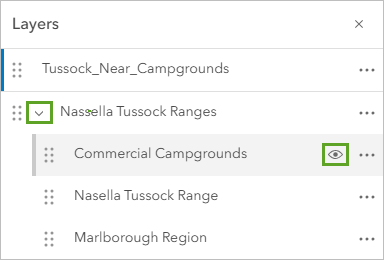
The campground locations are removed from the map.
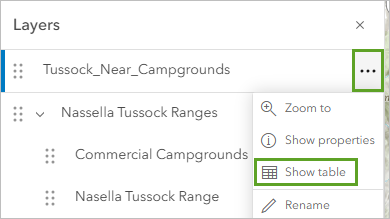
- In the Layers pane, for Tussock_Near_Campgrounds, click Options and choose Show table.
The table appears.
The table appears, showing the records for the layer.
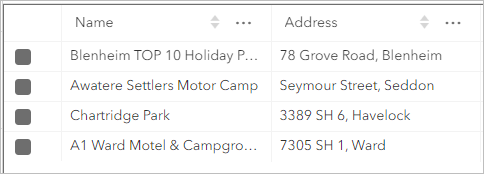
Because you set a filter on the layer, only the four campgrounds with Nassella tussock are shown.
Note:
If more than four records are shown in the table, it may mean the Filter pane has reopened. Click Save or close the filter pane to view the table with the filter applied.
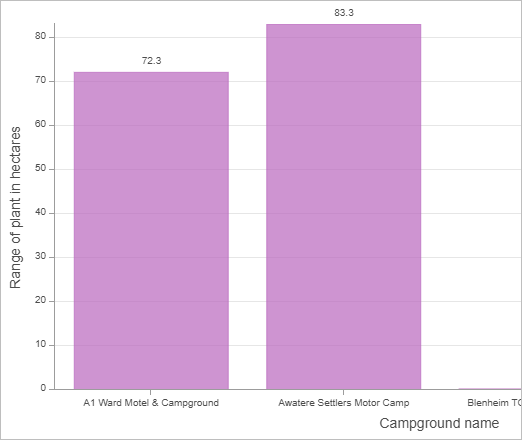
The Summarized area in Hectares field shows the total area of Nassella tussock within each campground range. The largest area of Nassella tussock is at the Awatere Settlers Motor Camp, where there are more than 83 hectares. The smallest area of Nassella tussock overlaps the Blenheim TOP 10 Holiday Park and has approximately 0.25 hectares. Keep in mind that the Nassella Tussock Range layer represents areas in which the plant has been found, not the actual plant density.
- Close the table and save the map.
Visualize analysis results
Next, you will showcase the results of the analysis using a bar chart.
- If necessary, in the Layers pane, click the Tussock_Near_Campgrounds layer to select it.
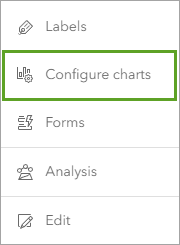
- On the Settings toolbar, click Configure charts.
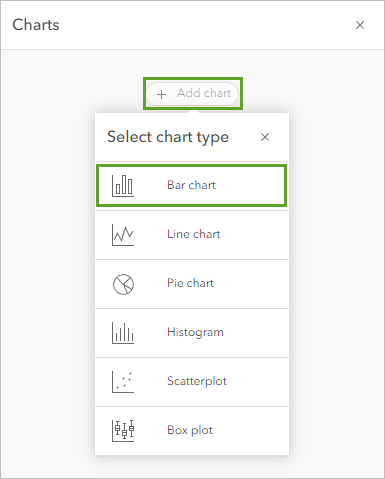
- In the Charts pane, click Add chart and choose Bar chart.
The Data pane appears where you can configure the chart.
- For Category, choose Name.
The chart updates to show the campground name on the x-axis and the count of features on the y-axis. You will update the chart so it uses the summarized area of Nassella tussock on the y-axis.
- For Numeric fields, click Select numeric fields and choose Summarized Area in Hectares.
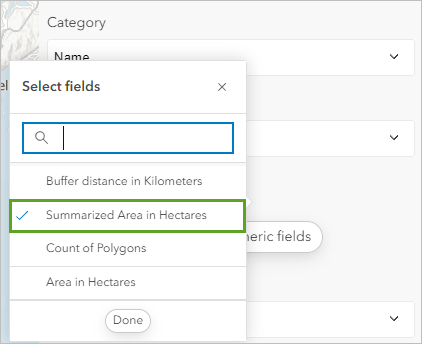
- Click Done.
The bar chart updates to show the total area of Nassella tussock near each campground.
- In the Data pane, enable Show data labels.
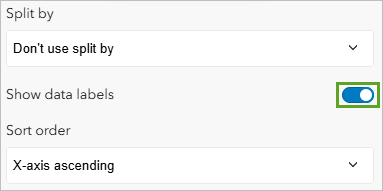
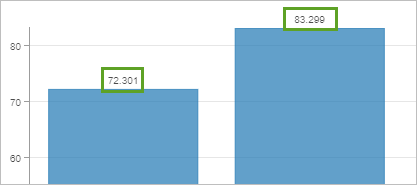
The labels appear on top of each bar.
- Click the Series tab.
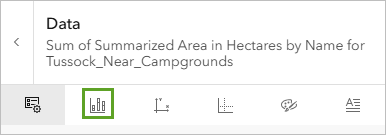
The Series tab includes configurations for multiple series and the chart style.
- Under Series, click Summarized Area in Hectare.

The Series style pane appears.
- Enter the hex value B966BD and close the Series style pane.
- Click the Axes tab.

The Axes tab includes configurations for the x-axis and y-axis.
The default character limit for the x-axis labels is 11, which is lower than the number of characters in all of the campground names. You will increase the limit so the full names are displayed.
- Under X-axis, for Label character limit, change the limit to 30.
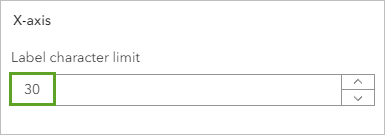
The x-axis updates to display the full campground names.

You will also update the configuration for decimal places in y-axis labels.
- Under Y-axis, for Decimal places, type 2.
Now less decimal places display for the numeric values. The chart is currently showing the default title and axis labels. You'll update them to something more informative.
- Click the General tab.

The General tab includes configurations for the titles and legends on the chart.
- For Chart title, replace the default title with Nassella Tussock Near Commercial Campgrounds.
The chart title updates.

- Update the axis titles as follows:
- For X-axis title, type Campground name.
- For Y-axis title, type Range of plant in hectares.
- Save the map.
In 25 minutes, you found publicly available data, calculated the total area of Nassella tussock within each campground range, and displayed the results in a bar chart. What's next?
You can find more tutorials in the tutorial gallery.
Perform a similar analysis to solve the Nassella tussock problem using the powerful geoprocessing tools in ArcGIS Pro.

