Perform line-of-sight analysis
You will determine whether the proposed locations of security personnel have a line of sight on Rittenhouse Square, a park in Philadelphia where the event will take place. Line-of-sight analysis immediately indicates whether a target can be seen from a specific location.
You'll perform line-of-sight analysis twice. First, you'll determine whether the park can be seen from the top of a nearby building. Then, you'll create an animated line of sight to visualize obstruction spots along a planned patrol route.
Visualize the city
Before you perform line-of-sight analysis, you'll navigate to Rittenhouse Square, Philadelphia, the location of the event. Then, you'll add 3D data to ArcGIS Earth to show the surrounding buildings.
- Start ArcGIS Earth desktop.
Note:
If you don't have ArcGIS Earth desktop, you can download it from the ArcGIS Earth product site.
ArcGIS Earth opens, showing the world as a 3D globe.
- If the Take a tour and learn more window appears, click Skip.
- On the top toolbar, check if you are signed in. If you are not, click Not signed in.

- If you're using an ArcGIS Online account, click Sign in and sign in using your ArcGIS organizational account credentials.
Note:
If you don't have an organizational account, see options for software access.
- If you're using an ArcGIS Enterprise account, sign in using the following steps:
- Click Portal Manager.
- In the Portals window, click Add Portal. Type the URL for your ArcGIS Enterprise portal and click OK.
- To use your portal, right-click its URL and choose Set As Active Portal.
- When prompted, sign in with the credentials for your ArcGIS Enterprise portal and close the Portals window.
Upon signing in, the globe's basemap may change to reflect your organization's default basemap. You'll change the basemap to show satellite imagery, so you'll have a better idea of what the area looks like.
- On the toolbar, click the Basemap and Terrain button. Confirm that the Imagery basemap is selected.

Next, you'll navigate to Rittenhouse Square, Philadelphia.
- Click the Search button, type Rittenhouse Square, and choose Rittenhouse Square, Philadelphia, PA, USA.

The globe navigates to a marker indicating Rittenhouse Square.
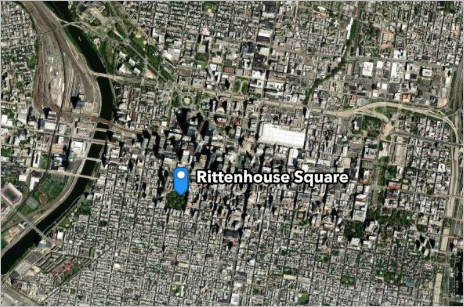
- Pan and zoom to center the extent around Rittenhouse Square.
Once zoomed in, the imagery shows several buildings surrounding the park.
Note:
Real-time data updates periodically. Your layers may differ from the example images.

Based on the imagery, you can tell these buildings are several stories tall. To conduct proper line-of-sight analysis, you'll need to know exactly how tall. You'll add a 3D layer of Philadelphia buildings to the map to visualize their height.
- On the toolbar, click the Add data button.

A window appears where you can access data from ArcGIS Online, ArcGIS Enterprise, local data, and web services.
- On the ArcGIS Online tab, click My Content and choose ArcGIS Online. In the search bar, type Philadelphia owner:Esri_Tutorials and press Enter.

- In the list of results, for the Philadelphia Downtown Buildings SL scene layer, click the Add button.

Note:
The SL in the name stands for a scene layer.
The globe zooms out and the layer is added to the map. It covers a large amount of Philadelphia, not just the immediate area around the park.
- Close the add data window.
- Navigate back to Rittenhouse Square.
- Right-click and drag the mouse to tilt the scene.

The 3D buildings provide a more realistic view of the park. They'll also be essential for determining where the line of sight might be blocked.
Note:
3D buildings for many cities are available on ArcGIS Living Atlas of the World. To learn how to create simple 3D structures using 2D building footprints, try the ArcGIS tutorial series Map Venice in 2D and 3D.
- On the toolbar, click the Basemap and Terrain button and change the basemap to Dark Gray Canvas.
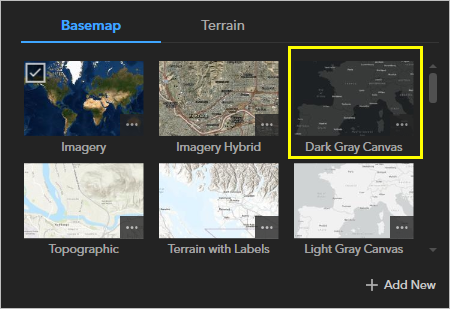
The basemap updates.
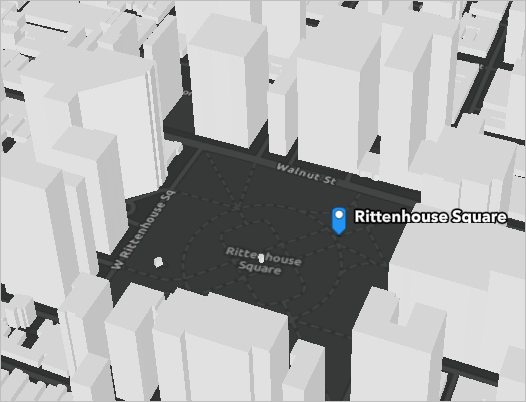
- On the toolbar, click Expand Table of Contents button.

- In the table of contents, right-click the Philadelphia Downtown Buildings SL layer and choose Properties. In the Properties pane that appears, click the Appearance tab.
- For Layer Transparency, type 40 percent.

The layer updates.
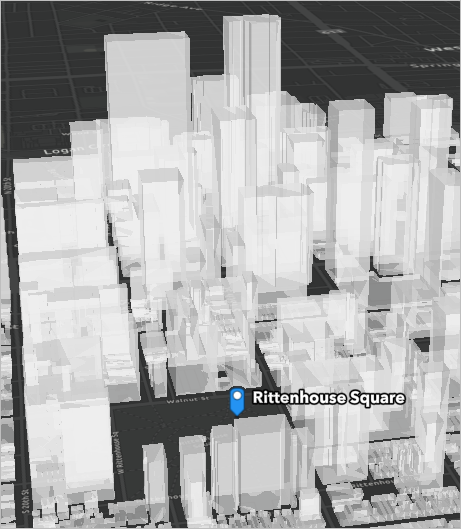
With the transparency lowered, you are able to see the difference in height for these buildings.
- Close the Properties pane.
Determine line of sight from a point
One of the proposed locations of security personnel is atop a nearby building. Planners believe the security personnel deployed there will be able to monitor the park from above. You'll conduct line-of-sight analysis to determine whether the deployed personnel would be able to see the park from their location.
- Click the Search button. Search for and navigate to 1818 Market St, Philadelphia, PA 19103.
The map navigates to a city block with two structures. The structure on the west side of the block is much taller than the other. This is the structure where the observer will be located.

Tip:
To remove a search result marker, open the search box and clear the text.
- Navigate until you can see both the building where the observer will be located and Rittenhouse Square (which is to the south of the building).

- On the toolbar, click the Interactive analysis button and choose Line of Sight.

A window appears with line-of-sight options.
- Confirm that the From point tab is active.
Next, you'll add the observer point. This point will represent the security personnel.
- Click the top of the building on Market Street on its southern side.
Tip:
While adding observer and target points, you can still tilt, zoom, and pan the map as necessary.

Note:
If you want to add the observer point to the ground instead of the roof, press T while clicking to add the point.
A blue observer point is added. The next location you click will be the location of the target point.
- Click the center of Rittenhouse Park to add the target point and double-click to finish.

Note:
If you placed the observer point on the top of the Market Street building instead of its side, the line of sight may be obstructed by the edge of the Market Street building.
A red target point is added. A line connects it to the observer point. The blue portion of the line indicates an unobstructed line of sight, while the purple portion of the line indicates where the line of sight is obstructed.
Tip:
Optionally, you can change the line's colors using the Color scheme option in the line-of-sight window.
Although the building on Market Street is significantly taller than those immediately around the park, the line of sight from the top of the building to the park's center is obstructed by another building. This location would not be an ideal location for security personnel.
- Click anywhere on the map to reactivate the line-of-sight tool. Add a line of sight from one of the buildings close to the Market Street building to the park.

In the example image, the line of sight is not obstructed and the line is blue from the observer point to the target point. Depending on the building you chose, your line of sight may be obstructed.
- If necessary, add more lines of sight until you create one that is unobstructed.
Tip:
To change the location of an observer or target point after you add it, click the point to select it. You can either drag the point to the new location or edit its coordinates in the window that appears.
Once you've created an unobstructed line of sight, you no longer need the obstructed ones. You'll delete them and save an image of the unobstructed line of sight for later use.
- Click an observer or target point for an obstructed line of sight to select it (x,y,z guides will appear to indicate the point is selected) and press the Delete key.
The line of sight is deleted.
- If necessary, delete any other obstructed lines of sight until only the unobstructed line of sight remains.
- Use a screen capture app or operating system tool on your device to save the line of site visualization.
- Close the line of sight window.
When you close the window, all lines of sight disappear.
Create an animated line of sight
The city also wants a ground vehicle to patrol the streets near the park. It wants to know ahead of time the areas on the patrol car's route where its view of the park will be blocked.
You'll draw a line to represent the route. Then, you'll create an animated line of sight using a moving vehicle model as the observer point. It'll be easier to draw a line that follows the streets with a different basemap and the 3D buildings turned off.
- In the table of contents, uncheck Philadelphia Downtown Buildings SL.

The buildings are hidden on the scene.
- Click the Basemap and Terrain button and change the basemap to OpenStreetMap.
- Tilt the scene so that you look straight down at Rittenhouse Square. Zoom out so you can see the entire park and a few blocks to its west.

This basemap emphasizes streets. Streets line Rittenhouse Square on every side, but the patrol is meant to cover some of the surrounding area as well. The route will begin at the intersection of Walnut Street and South 18th Street.
- On the toolbar, click the Draw button and choose Line.

A window appears with options for drawing.
- In the window, confirm that the General tab is active. On the map, click the intersection of Walnut Street and South 18th Street (the northeast corner of Rittenhouse Square).

Once you click the map, you start drawing the line. Each subsequent location you click will be another vertex in the line.
- Click the intersection of Walnut Street and South 21st Street.

A line traveling east to west is created. The measurement above the line indicates a length of about 440 meters. You'll continue to add intersections to complete the route.
- Click the following intersections in order:
- South 21st Street and Locust Street
- Locust Street and West Rittenhouse Square
- West Rittenhouse Square and South Rittenhouse Square
- South Rittenhouse Square and South 18th Street

- To complete the route, double-click near the starting point at Walnut Street and South 18th Street.

- Close the window with drawing options. Change the basemap to Imagery and expand the table of contents.
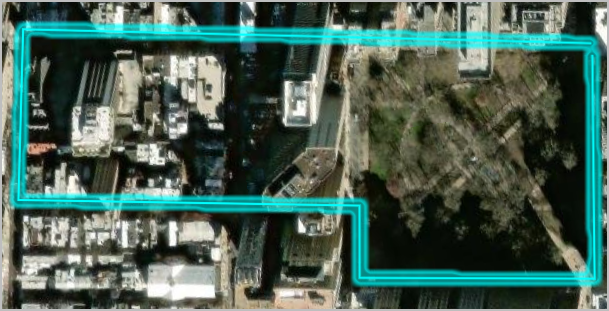
The route displays on the map more clearly with the Imagery basemap. A new layer, Untitled line, also appears in the table of contents.
Note:
If you do not want the path to be visible in the animation, you can uncheck the layer. Doing so will not influence the path taken during the animation.
- In the table of contents, right-click Untitled line and choose Rename. Type Route and press Enter.
Next, you'll perform animated line-of-sight analysis on the route.
- In the table of contents, turn on the Philadelphia Downtown Buildings layer and click Collapse Table of Contents to close the table of contents.
- On the toolbar, click the Interactive analysis button and choose Line of Sight.
- In the line-of-sight window, click the Animation tab.

- If necessary, for Select line, choose Route, and for Model, choose Vehicle.
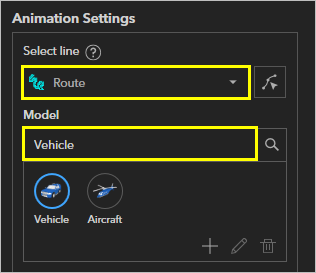
The model represents the observer. It is automatically placed on the starting point of the route. Next, you'll place the target point.
Note:
By default, the line-of-sight analysis is performed from the front of the moving observer with a vertical offset of 2 meters. You can change the vertical offset in the Model window at the top of the scene.
- On the scene, click the center of the park and double click to finish.
The animation is now ready to start.
- In the line-of-sight window, click Start animation.
The vehicle starts moving along the route you drew.
Tip:
You can zoom, pan, and tilt the scene while the animation is playing for a better view of the vehicle. To pause the animation, click Stop animation.

The example image shows a location along the route where the line of sight of the park is obstructed.
Tip:
To make the animation play faster or slower, adjust the Speed parameter in the line-of-sight window.
- When the vehicle reaches the end of the route, click Stop animation.
The line of sight is obstructed almost any time the vehicle is not on a road directly adjacent to the park. At ground level in a dense city, it's difficult to see far. The ground patrol will likely need to be supplemented with observers on the tops of buildings or aerial observers in helicopters.
- Close the line-of-sight window.
You've added a layer of 3D buildings to downtown Philadelphia, Pennsylvania. You also determined the line of sight for immobile and mobile observers. Based on your findings, you can determine where security personnel can see the park and where they can't.
Perform viewshed analysis
Previously, you performed line-of-sight analysis, which indicated whether a specified target point could be seen from a specified observer point. Next, you'll perform viewshed analysis. A viewshed indicates all locations that can be seen from a specified point. With viewsheds, you can determine not only whether observers can see the park, but also how much of the surrounding area they can see and what obstructions prevent them from seeing more.
First, you'll perform viewshed analysis for a single area. Then, you'll create an animated viewshed for a helicopter patrol.
Determine viewshed from a camera
You can create viewsheds for a single point or a dynamic line. You can also create a viewshed using the same camera you use to navigate ArcGIS Earth. Using the camera allows you to tilt the perspective of your observer in the position you want. You'll use the camera to determine the viewshed of an observer on a nearby building.
- If necessary, start ArcGIS Earth, sign in, and navigate to Rittenhouse Square, Philadelphia.
- On the toolbar, click the Interactive analysis button and choose Viewshed.

The Viewshed window appears. The pointer changes to show the viewshed of wherever you click on the scene.
- In the Viewshed window, click Apply Camera.

The pointer reverts to normal. Instead of clicking a place on the map to be the observer point, you'll move the ArcGIS Earth camera to represent the observer.
- In the viewshed window, click Apply camera.

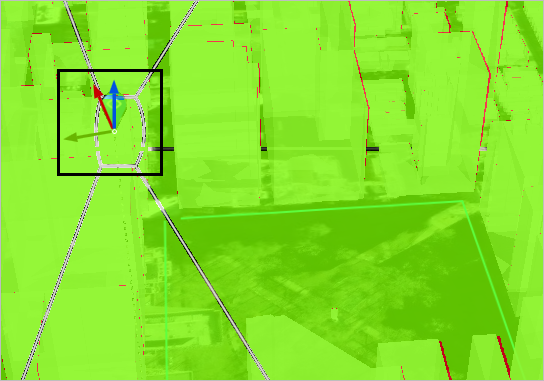
The camera appears on the scene and various areas are either green or red, based on visibility. There are also arrows on the camera that allow you to adjust its location, heading, and other properties.
- Click the camera and move it to so it is located on a nearby building of your choice. Tilt the scene to face the park.
- In the viewshed window, adjust the Heading, Tilt, Horizontal angle, Vertical angle, and Range parameters until the park is covered with a blue area.
These parameters change the direction the observer is facing. The blue areas represent everything that can be seen by the observer. Because you haven't navigated away from the camera's location, almost everything on the scene is highlighted green.
- Navigate the scene to a different position.

The marker indicates the location of your camera when you applied the viewshed. The purple areas represent areas that cannot be seen by the observer. Due to the many buildings in the area, there are actually many places in and around the park that cannot be seen.
Tip:
If you want to adjust the position of the observer, you can either drag the observer on the scene or edit the observer point's coordinates.
- Use a screen capture app or operating system tool on your device to save the viewshed visualization.
- Close the viewshed window.
The viewshed is removed. By creating multiple viewsheds from different rooftops, the security deployment can compensate for blind spots in individual observers.
Create an animated viewshed
Next, you'll create a dynamic viewshed for a moving observer. Previously, you conducted dynamic line-of-sight analysis for a vehicle on the ground. However, you found that the vehicle's line of sight was almost always obstructed by buildings except when it was directly beside the park. Instead of creating a viewshed for a ground vehicle, you'll create one for a helicopter flying above the area.
You'll base the route of the helicopter on the route of the patrol car from your line-of-sight analysis. You'll need to adjust the route's height to be appropriate for an aerial craft.
- In the Data pane, expand the Table of Contents, right-click Route and choose Properties.

A window opens with options for the layer.
- On the General tab, for Altitude, choose Absolute and type 200 m.

The route is elevated 200 meters into the air, a reasonable height for a helicopter.
- Close the layer properties window and the collapse the table of contents. On the toolbar, click Interactive analysis and choose Viewshed.
- In the Viewshed window, click the Animation tab.
- On the Animation tab, for Select line, verify Route. For Model, choose Aircraft.

The vehicle model is replaced by one representing an aircraft.
- Click Start animation.
The camera shows the aircraft as it travels the route. What is visible changes as the aircraft moves.

Note:
By default, the direction of the viewshed is consistent with the direction the observer is moving along the route. You can change the direction of the viewshed by adjusting the Heading, Tilt, Horizontal angle, Vertical angle, and Range parameters in the viewshed window.
As with the dynamic line-of-sight animation you created for a ground vehicle, you can pause this animation at any point along its route or change the speed of the animation.
The view from the helicopter is much better than that from the ground vehicle. However, even the helicopter has many blind spots depending on its location over the park. These blind spots can be supplemented by rooftop and ground observers.
- When the animation is finished, close the viewshed window.
In this tutorial, you performed line of sight and viewshed analysis to determine which areas are and are not visible from vantage points around Rittenhouse Square in Philadelphia. Your analysis highlighted obstructions that prevented visibility from both the ground and air. By comparing multiple viewsheds, you can create a security deployment in which a handful of observers can watch the maximum amount of area.
The workflow you followed in this tutorial can be applied to any security workflow. Visibility analysis is also important to many defense and urban planning workflows.
You can find more tutorials in the tutorial gallery.

