Filter and join data in ArcGIS Insights
Import a workbook package
You will start by importing a workbook package with the results from the previous tutorial into ArcGIS Insights. If you already completed the previous tutorial, skip to the next section.
- Download the filter-and-join-data.insightswbk file.
The item is an Insights workbook package containing all the data and analysis from the Analyze aggregated data in ArcGIS Insights tutorial.
- Locate the downloaded file on your computer.
Note:
Depending on your web browser, you may have been prompted to choose the file's location before you began the download. Most browsers download to your computer's Downloads folder by default.
- Do one of the following:
- To complete the tutorial in Insights in ArcGIS Online, go to ArcGIS Insights and click Sign in. Sign in to your ArcGIS organizational account.
- To complete the tutorial in Insights in ArcGIS Enterprise, sign in to your portal. On the ribbon, next to your username, click the App Launcher button and choose Insights.
- To complete the tutorial in Insights desktop, launch the Insights desktop app and sign in to your ArcGIS organizational account, if prompted.
Note:
To access Insights, your organization’s administrator must grant you a license for it. If you don’t have an ArcGIS account or a license for Insights, see options for software access.
You will import the package you downloaded.
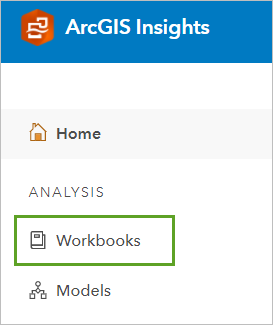
- On the home page, click the Workbooks tab.

The Workbooks page appears. Depending on your previous use of Insights, this page displays the workbooks that you already created or that were shared with you by members of your organization.
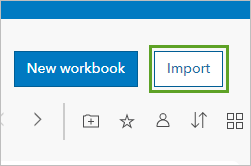
- Click Import and open the file that you downloaded in step 1.

The workbook is loaded onto your Workbook page.
Create a page
You're entering a new phase of your analysis of bicycling accidents in Ottawa. To keep this phase separate from your previous analysis, you'll create a page in your workbook, add the necessary data, and create maps. First, you'll need the Wards dataset.
- In ArcGIS Insights, ensure you are on the Workbooks tab.
- In the list of workbooks, click the name of the Ottawa cycling accidents workbook to open it.
- Drag the Wards dataset from the data pane to the New page drop zone at the bottom of the page.

A page is created with the Wards dataset in the data pane.
- Click the Collisions by ward tab to return to the first page.

- Drag the Collisions dataset from the data pane to the Page 2 tab.
Because you plan to analyze the collisions based on the routes where they occur, you'll also add a dataset with the city's cycling network. This data was added to the Learn ArcGIS organization and shared publicly. You can access the dataset through the ArcGIS public tab in Insights.
- On the ribbon, click the Add to page button.

The Add to page window appears.
- Click the ArcGIS public tab.
- In the search bar, type Somerset routes Learn_ArcGIS.
- Click the Somerset routes dataset by Learn_ArcGIS.

- Click Add.
The dataset is added to the data pane. Additionally, a map card is created showing the routes. You won't need this map, so you'll delete it.
- On the map, click the Card options button and click the Delete button.

Filter the data
You want to focus your analysis on Somerset ward and on collisions involving cyclists. Although you filtered the Collisions dataset on the previous page, you copied the full, unfiltered dataset to the second page. You'll create two maps, one for collisions and one for wards, to filter the data. You already enabled location for the Collisions layer, so you don't need to do so again.
- Drag the Collisions dataset onto the page and drop it on the Map drop zone. Drag the Wards dataset onto the empty part of the page and drop it on the Map drop zone.

Next, you'll filter the Collisions dataset to show only collisions involving cyclists. Previously, you applied this filter to the map card, rather than the dataset. A card filter only affects the card and creates a filtered dataset while the original, unfiltered dataset is still available for use in your analysis. When you apply a filter to a dataset, no new dataset is created. All cards that use the filtered dataset change to include the filter.
Previously, you used both the filtered and unfiltered dataset to normalize the data, so creating a card filter was ideal. You won't use the unfiltered dataset in this part of the analysis, so you'll use a dataset filter.
- In the data pane, expand the Collisions dataset. Point to the Number of cyclists field and click the Dataset filter button.

- In the Filter by Number of cyclists pane, change the left node of the histogram from 0 to 1. Click Apply.
The map of collisions updates to show only the collisions that involved cyclists. Next, you'll filter the collisions again to show only collisions that involved cyclists in Somerset ward. You'll use a card filter to create a new dataset.
- Click the map card showing wards to activate it. Zoom to Somerset ward and click it to select it.
Tip:
Point to the wards to view their names in a ToolTip.

- Drag the selected ward to the map of collisions and drop it on the Filter by selected feature drop zone.

The Spatial Filter pane appears.
- In the Spatial Filter pane, ensure that Choose a layer to filter is set to Collisions, Choose a layer to filter by is set to Wards, and Choose a type of filter is set to Intersects.
These parameters will filter the Collisions layer using the Wards layer. The Intersect filter type means that only collisions that intersect the wards will be shown.
If only some features in a dataset are selected, the filter is run using only the selected features. You've selected Somerset ward in the Wards layer, so the filter shows only collisions that occurred in that ward.
- Click Run.
The filter is applied on the map card.

Additionally, a new dataset was added to the data pane.
- In the data pane, point to the Spatial Filter 1 dataset and click the Rename dataset button. Type Somerset collisions and press Enter.
You've filtered the data for use in your analysis. You no longer need the two map cards you created for filtering.
- Delete the two map cards so that there are no cards remaining on your page.
Join routes and collisions
To analyze cycling collisions by route type, you'll combine the collision data and cycling network data into one dataset. You can combine two datasets using a process called a spatial join.
- On the ribbon, click the Create relationships button.

The Create relationships window appears.
The SomersetRoutes layer is not enabled in the Create relationships window. That is because remote feature layers (feature layers that are not hosted within your own organization) do not support creating joins. You'll have to create a copy of the layer within your workbook.
- Close the Create relationships window.
- In the data pane, point to the SomersetRoutes layer, click the Dataset options button, and choose Copy to workbook.

A new layer named SomersetRoutes 1 is added to the data pane. You can remove the original remote layer.
- Point to the SomersetRoutes layer, click the Dataset options button, and choose Remove.

You can now use the copied layer to create a join.
- Click the Create relationships button.
All layers are now enabled in the window. You'll choose the datasets with which to create a relationship.
- In the Create relationships window, click Somerset collisions and SomersetRoutes 1.
The datasets are added to the window. Joins must be made based on shared attributes in the two datasets. For your data, location fields were selected as the joining fields, meaning features in the same location will be joined.
By default, ArcGIS Insights performs inner joins, which means that only features that match for both datasets are included in the joined dataset. If any collisions did not occur on bike routes, they are removed. You want to keep all collisions, regardless of whether they intersect the cycling network, so you'll change the join type.
- Between the two datasets, click the Edit relationship button.

The Edit relationship window appears. You can keep all data from both datasets, all data from the left dataset, or all data from the right dataset. The collisions dataset is the left dataset in the join, so you'll choose a left join.
Note:
If you added the routes dataset first, so that Somerset collisions is on the right side of the join, choose Right as the join type instead.
- In the Edit relationship window, for Choose relationship type, choose Left.

- Close the Edit relationship window. Click Finish.
The joined dataset is added to the data pane.
- In the data pane, collapse the Collisions dataset and expand the Somerset collisions - SomersetRoutes 1 dataset.
The fields in the joined dataset include the fields from the Collisions dataset and the SomersetRoutes dataset. The EXISTING_C field contains descriptions of the types of bike routes.
- Change the name of the EXISTING_C field to Route type.
Next, you'll create a map based on route type using the joined dataset.
- In the data pane, for the Somerset collisions - SomersetRoutes 1 dataset, click the circles next to Coordinates and Route type. Drag the fields onto the page and drop them on the Map drop zone.

A new map card is created.

The color of each collision corresponds to the type of route on which the collision occurred. However, some collisions occurred at the intersection of two different types of routes. You'll change the symbol for these collisions.
- On the map card, click the Route type arrow.

- In the Layer options pane, click the Symbology tab. For Symbol type, choose Pies.

The symbols on the map change to pie charts. Most symbols have only one color, but collisions that took place at the intersection of two route types have two colors. However, the symbols are large and overlapping, so you'll change the size.
- Click the Appearance tab. For Size (min - max), change the minimum size to 8 px and the maximum size to 10 px.

Without a legend, the symbols on the map aren't particularly meaningful. You'll add a legend card to the page.
- Click the Legend tab. Click the Pop out legend button.

A legend card is added to the page.
- Move the legend below the map.
- If necessary, close the Layer options pane.
Next, you'll create a heat chart that shows collisions by route type and year.
- In the data pane, for Somerset collisions - SomersetRoutes 1, select the Year and Route type fields.
- Drag the fields onto the page next to the map card, point to the Chart drop zone, and drop them on the Heat Chart drop zone.

- Drag the heat chart's right handle to expand the chart's size.

Lastly, you'll rename the cards and page.
- Click the empty space on the page to deactivate the cards. Above the map, click Card 1 and type Collisions with cyclists in Somerset ward. Rename the chart card Collisions by route type and year.
- At the bottom of the page, change the name of Page 2 to Collisions by route type.
- On the ribbon, click the Save button.
Interpret results
Watch the video to see how you can use these charts to interpret results.
In this tutorial, you created maps and charts that show the relationship between traffic collisions involving cyclists and route type.


