Create local scene
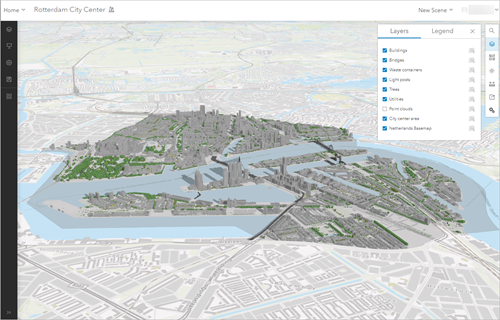
In this tutorial, you will author a local 3D scene in ArcGIS Pro, which will then be published as a web scene in ArcGIS Online. The end result will look like the following example image.
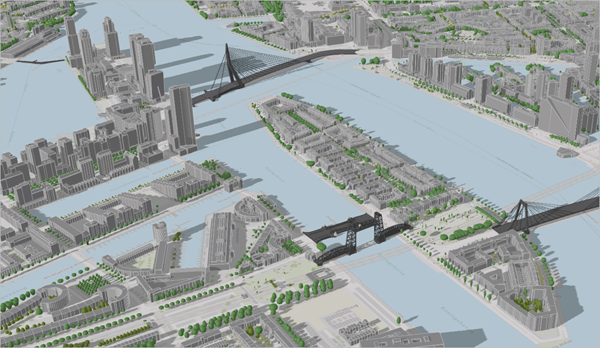
First, you'll define the scene, modify its settings, and add a basemap and elevation information.
Download the data and create a scene
First, you'll download the compressed .zip file that contains data needed for this tutorial.
- Download the RotterdamCityCenter.zip compressed folder on your computer.
Note:
Depending on your web browser, you may be prompted to choose a file location before you begin the download. Most browsers download to your computer's Downloads folder by default.
- Locate the downloaded RotterdamCityCenter.zip file, right-click it and extract the content to a location of your choice, such as the Documents folder.
Next, you will create a local scene in ArcGIS Pro.
- Start ArcGIS Pro. If prompted, sign in using your licensed ArcGIS organizational account.
Note:
If you don't have access to ArcGIS Pro or an ArcGIS organizational account, see options for software access.
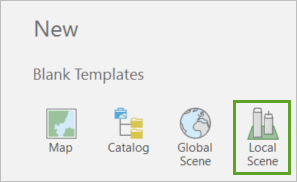
- Under New Project, select Local Scene.
- In the New Project window, set the following parameter values:
- For Name, type Rotterdam_Center_City_Planning.
- For Location, click Browse and browse to your extracted data folder, RotterdamCityCenter, select it, and click OK.
- Uncheck the Create a new folder for this project box.
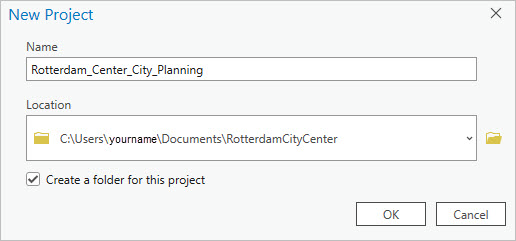
The ArcGIS Pro project will be created in the same folder where your data is.
- Click OK.
A local scene is created.
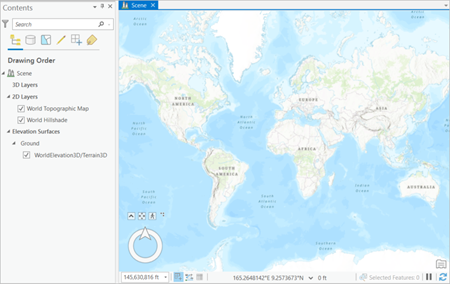
Note:
A local scene allows you to choose any projected coordinate system. In this example, the coordinate system must be in the Dutch national projection RD_New to ensure any data added to the web scene or interactive analysis, such as measure, will return the correct coordinates and measurement units.
In this section, you created a project in ArcGIS Pro and added a local scene.
Modify the scene settings
Next, you'll remove some unwanted layers and choose some of the scene settings.
Depending on your default ArcGIS Pro options, the scene may already include some default basemap and elevation layers. However, you want to use more specific layers instead, so you'll remove the default ones.
- In the Contents pane, under the 2D Layers category, right-click every layer present, and choose Remove.
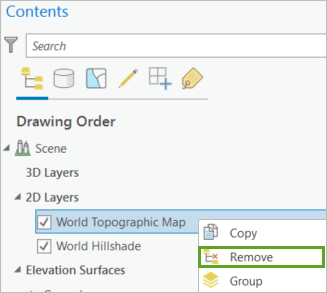
- Similarly, under the Elevation Surfaces category, under Ground, right-click any layer present, and choose Remove.
No layers are left, and the Contents pane looks like the following example image.
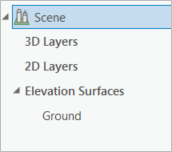
You'll now customize various settings for the scene. First, you'll choose a coordinate system.
- In the Contents pane, double-click the Scene name.
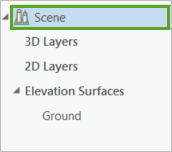
The scene's Properties window appears.
- In the Map Properties: Scene window, click the Coordinate Systems tab.
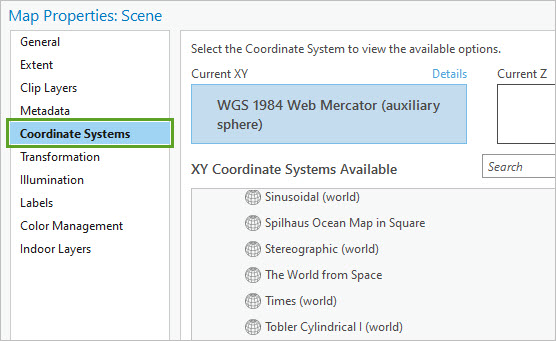
By default, the coordinate system is WGS 1984 Web Mercator. However, you want to use a spatial reference that is more precisely adapted to your area of interest. In this project, you'll use RD New.
Note:
RD New is the Dutch national coordinate system used for large and medium scale mapping and engineering survey in the Netherlands.
When working with your own data, you must select a coordinate system commonly used in your region. Because you want to enable precise measurement, you must choose a projected coordinate system that preserves distances. To learn more about projections, see Choose the right projection.
Your scene and all your data layers must be in the same coordinate system to avoid having to reproject the data on the fly, which would slow down the scene display.
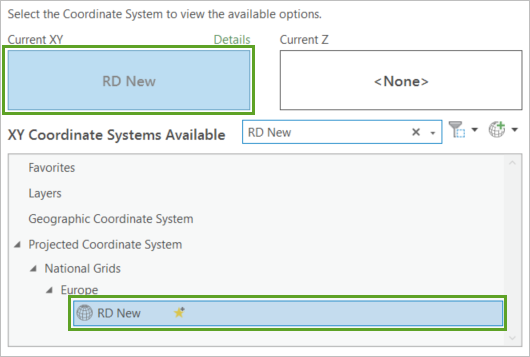
- In the search box, type RD New and press Enter.

- Under XY Coordinate Systems Available, expand Projected Coordinate System, National Grids, and Europe. Click RD New.
In the Current XY box, the selected coordinate system updates.
Next, you'll change the scene illumination settings to match the sun's position in the Netherlands at 10 a.m.
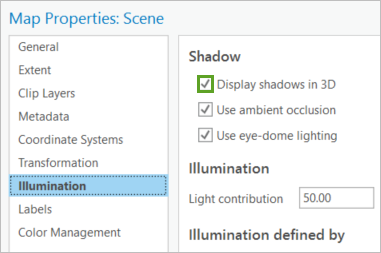
- In the Map Properties: Scene window, click the Illumination tab.
- Check the Display Shadows in 3D box.
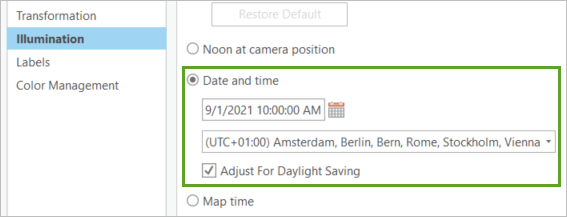
- Click the Date and time option to define the illumination.
- Expand the date picker. Choose a date of your choice, such as today's date. In the time field, type 10:00:00 AM. Click away from the date picker to close it.
- Expand the time zone drop-down list and choose (UTC +1:00) Amsterdam, Berlin, Bern, Rome, Stockholm, Vienna).
- Check the Adjust For Daylight Saving box.
You'll now change the scene's name.
- In the Map Properties: Scene window, click the General tab.
- For Name, type Rotterdam City Center.

Finally, you'll choose a background color for the scene.
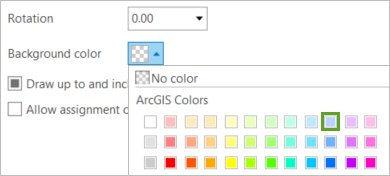
- For Background color, expand the color picker and choose the Sugilite Sky color (first row, tenth column).
- Check the Allow assignment of unique numeric IDs for sharing web layers box.
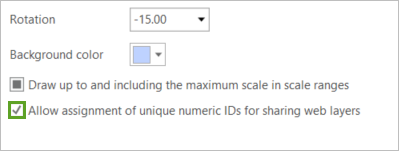
This option will be useful when you publish your layer to ArcGIS Online.
When the scene is complete, the background color will appear primarily where the sky is located. Choosing a sky-blue color will make the scene easier to comprehend.
- Click OK.
The settings update. Since the scene is empty, for now only the blue background displays.
In this section, you removed some unwanted layers and chose some of the scene settings.
Add a basemap and area of interest
You'll now add a basemap and define your area of interest.
A basemap serves as a reference layer on which you can overlay data from layers and visualize geographic information. In the scene you are building, the basemap will provide a ground level representation that will harmonize well with the data layers and will give a sense of continuity to the whole scene.
You'll add a publicly available topographic basemap. That layer, available through ArcGIS Living Atlas, was specifically created for the Netherlands and uses the RD New coordinate system. It features administrative boundaries, water bodies, streets, parks, building footprints, and more.
Note:
If you don't have a basemap in your local coordinate system, you can learn how to create one in the Design and publish basemaps web course.
- On the ribbon, click the View tab. In the Windows group, click Catalog Pane.
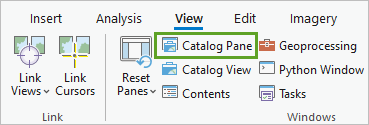
The Catalog pane appears.
- In the Catalog pane, click the Portal tab and choose Living Atlas.
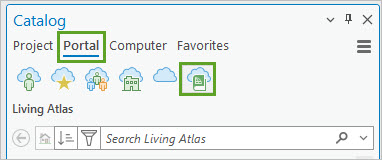
- In the search box, type Topo RD and press Enter.
- In the result list, right-click the Topo RD (vector tiled) layer and choose Add To Current Map.
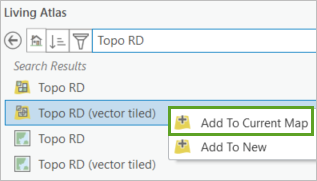
Tip:
Look at the icon to make sure you choose the vector tiled layer and not the web map with the same name.
The layer appears in the scene. Because it is a 2D layer, in the Contents pane, it is added under the 2D Layers category. You'll change its name.
- In the Contents pane, click the Topo_RD_vector layer, and click it again to edit it. Type Basemap of the Netherlands and press Enter.
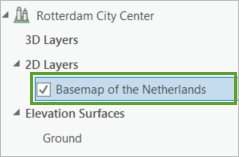
The basemap represents the entire country of Netherlands; however, your scene will only focus on one part of the Rotterdam city center. You'll add a layer to show the boundaries of your area of interest.
- In the Catalog pane, click the Project tab.

- Right-click Folders and choose Add Folder Connection.
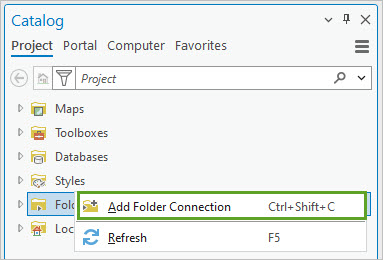
- Navigate to and click the RotterdamCityCenter folder and click OK.
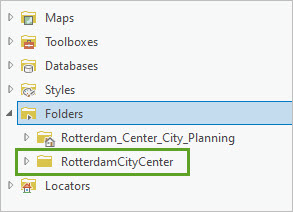
The folder connection appears in the list. This allows you easier access to the data in that folder.
- Expand RotterdamCityCenter > Rotterdam.gdb. Right-click City_center_area and choose Add To Current Map.
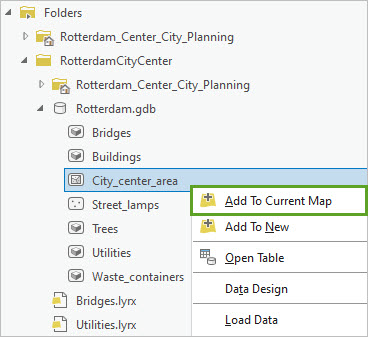
The 2D City center area boundary layer is added to the scene. You'll zoom in to it.
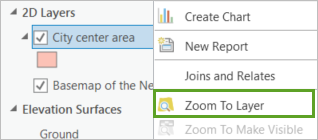
- In the Contents pane, right-click City center area and choose Zoom To Layer.
Note:
The color of the City center area layer is assigned randomly and may differ.
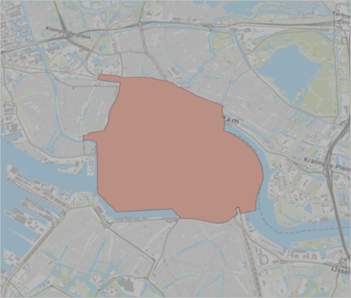
You'll change its symbology so that it does not obstruct the basemap and harmonizes well with it.
- In the Contents pane, ensure the City center area layer is selected.
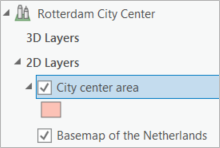
- On the ribbon, on the Feature Layer tab, in the Effects group, for Transparency type 50.0%.

The City center area layer becomes semi-transparent, letting the basemap show underneath. You'll change the color of the layer to gray.
- In the Contents pane, right-click City center area and choose Symbology.
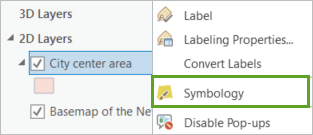
The Symbology pane appears.
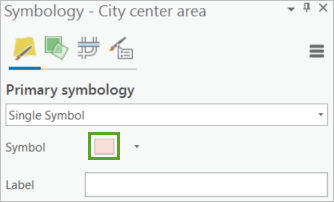
- In the Symbology pane, next to Symbol, click the Symbol color.
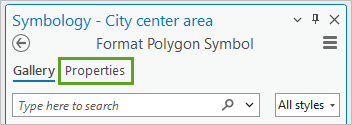
- If necessary, click the Properties tab.
- At the bottom of the Symbology pane, click Auto Apply to enable it.

Now when you make changes, they will be automatically applied on the map so you don't have to click the Apply button every time.
- On the Properties tab, for Color, expand the color picker and choose Gray 30% (fourth row, first column).
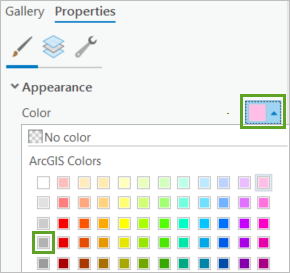
The color updates on the map.
- For Outline color, expand the color picker and choose No Color.
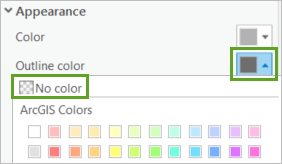
The City center area layer is now a transparent gray that defines the area of interest without obstructing the basemap.
- Close the Symbology pane.
In this section, you added a basemap and defined the area of interest. Next, you will add the elevation layers.
Add elevation
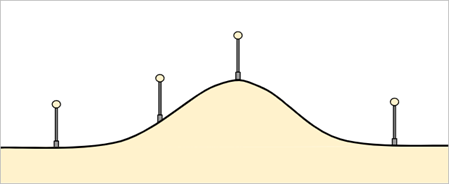
An elevation layer gives precise information about the vertical position of the ground compared to the sea level. It will represent hills, valleys, and other terrain changes throughout the scene. This information is also important to have, because it will tell ArcGIS Pro how to position elements in the 3D scene, so they appear placed on the ground. For instance, in the following diagram, the street lamps are all positioned on the ground, following the elevation variation.
You'll add a publicly available elevation layer. The layer, available through ArcGIS Living Atlas, uses the RD New coordinate system and contains elevation information for the entire country of Netherlands.
Note:
You can learn how to create a custom elevation layer set in your local coordinate system in the Creating and Using Elevation Layers in ArcGIS Online & ArcGIS Pro blog post and the Is it possible to create a custom elevation layer to use in the ArcGIS Online scene viewer? technical support post.
- In the Catalog pane, click the Portal tab and choose Living Atlas.
Tip:
If necessary, you can reopen the Catalog pane: on the ribbon, on the View tab, in the Windows group, click Catalog Pane.
- In the search box, type Elevation 3D (RD) and press Enter. In the list of results, right-click Elevation actueel (RD) and choose Add To Current Map or drag the layer into the scene.
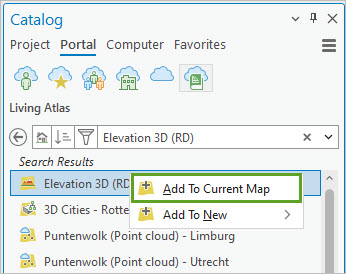
The elevation layer is added to the scene. In the Contents pane, it is listed in the Ground section.

Note:
Because the region of Rotterdam is relatively flat, the terrain variations are subtle, so you may not see them easily in the scene.
You have now defined your scene's ground. Any 2D layer added to the scene will be positioned on that ground. For instance, the 2D basemap layer is now draped onto the ground, and every point of its surface reflects the variations of the underlying ground elevation.
Note:
2D layers do not have elevation information (or z-value). In contrast, 3D layers have elevation information, so the features they contain will be positioned vertically based on their z-value.
- On the Quick Access Toolbar, click Save Project to save your project.

So far in this tutorial, you created a 3D scene, customized its settings, added a basemap, and defined the ground elevation. Next, you will add several data layers to the scene.
Add data layers to the scene
You will now add several data layers to make the scene richer and more informative. The layers can be of different types—some 2D, some 3D—and can be further symbolized for optimal results. You will add the following layers:
- Buildings
- Bridges
- Waste containers
- Street lamps
- Trees
- Underground utilities
Note:
The scene you are building in this tutorial is thematic, which means that the features (buildings, bridges, trees, and so on) are not represented in a photo-realistic manner, but instead in a schematic style. For instance, the buildings will be shown as simple 3D shapes and a single solid color, and the trees will be generalized shapes. To obtain a scene that is visually coherent and aesthetically pleasing, it will be important to symbolize all the layers in a similar schematic style, and ensure that they all show a similar level of detail.
Add buildings
Buildings are a crucial part of the city landscape and any new construction project must be visualized and evaluated with the existing buildings displayed around it. You'll add to your scene a 3D multipatch layer that represents all buildings of the Rotterdam city center.
Note:
The original data for this layer was in the CAD format (the Autodesk DWG format) and was converted into a multipatch feature class using the ArcGIS Data Interoperability extension.
There are various approaches to generate building layers. One of them is described in the Working with the ArcGIS Solution for 3D Buildings web course.
- In the Catalog pane, click the Project tab.
- From the Rotterdam.gdb, add Buildings to the scene.
The Buildings layer appears in the scene. In the Contents pane, because it is a 3D multipatch feature class, it is automatically added to the 3D Layers category.
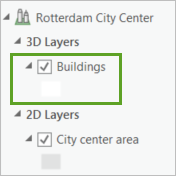
You'll refine the layer's appearance, so that it better integrates in the scene.
- In the Contents pane, double-click the Buildings symbol.
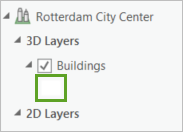
Tip:
This is another way to open the Symbology pane.
The Symbology pane appears.
- In the Symbology pane, if necessary, click the Properties tab. and click the Layers tab.
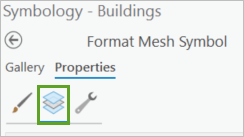
The options for the Material fill are currently displayed. This will determine how the building surfaces are displayed.
- Under Appearance, for Material mode, choose Replace.
- For Color, expand the color picker, and select Gray 40% (fifth row, first column).
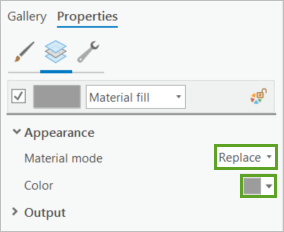
You have chosen the new color for the building surfaces. To make the edges of the buildings more visible, you will also change the outline stroke.
- Click the Structure tab.

- Under Layers, click Add symbol layer and choose Stroke layer.
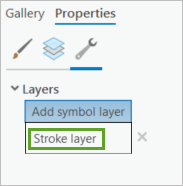
The Stroke symbol layer is added.
- Go back to the Layers tab and click the Solid stroke row to select it.
- Under Appearance, for Color, expand the color picker and choose Gray 20% (third row, first column).
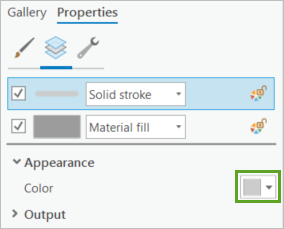
The buildings draw with the new symbology.
- Close the Symbology pane.
Now you'll explore the scene.
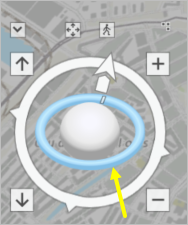
- In the scene, above the Navigator wheel, click Show full control.

The Navigator wheel expands to include 3D navigation functionality.
- Use the middle Navigator wheel to tilt and rotate the scene. Use the mouse wheel button to zoom in and out and drag to pan.
Tip:
To learn more about the options for 3D navigation, see Navigation in 3D.
- Zoom closer into the scene to review the buildings.
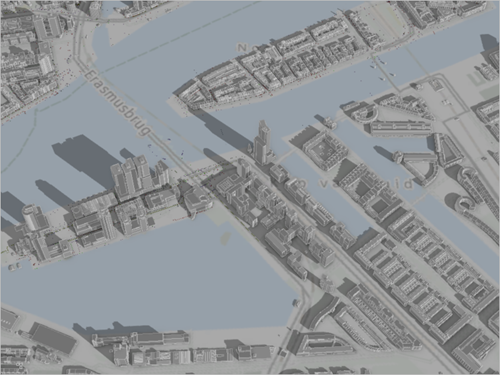
The buildings in the scene are represented with a level of detail named, by convention, LOD2. This corresponds to a coarse representation that includes the general shapes of the buildings, standard roof structures, no textures, and large building parts (for parts larger than 4 m and 10 m2). LOD2 is a good choice for this thematic scene, which aims to act as a backdrop for construction planning projects. The existing buildings are present, but they will still allow the users to focus on the new development projects.
- Press Ctrl+S to save the project.
In this section, you added the buildings of Rotterdam's city center to the scene and refined their appearance.
Add bridges
You'll now add bridges to the scene. The Bridges 3D layer contains the often iconic bridges of the City of Rotterdam. The level of detail is again LOD2, which harmonizes well with the Buildings layer.
Note:
Like for the Buildings layer, the original data for this layer was in the CAD format and was converted into a multipatch feature class using the ArcGIS Data Interoperability extension extension.
To save you time in this tutorial, it was then saved as a layer file (.lyrx), that includes the desired appearance.
- In the Catalog pane, browse to Folders > RotterdamCityCenter.
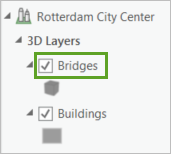
- Add the Bridges.lyrx to the scene.
The Bridges layer appears. In the Contents pane, it is listed in the 3D Layers section.
- In the scene, click one of the bridges.
The informational pop-up for this bridge appears. It contains many attribute fields that are not needed in the scene.
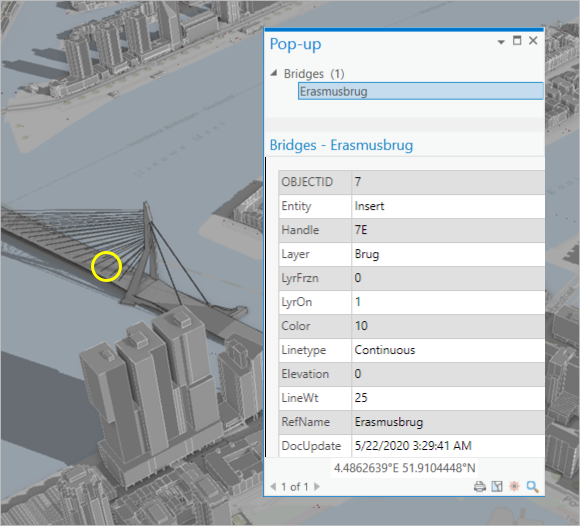
You'll customize the pop-up to only display the bridge names.
- Close the pop-up.
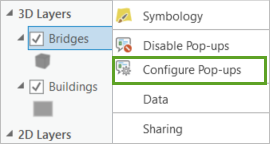
- In the Contents pane, right-click the Bridges layer and select Configure Pop-ups.
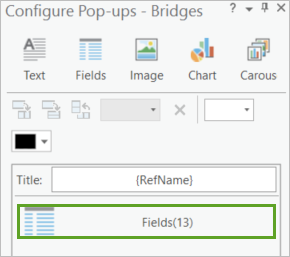
- In the Configure Pop-ups pane, double-click the Fields(13) row to open the Fields Options pane.
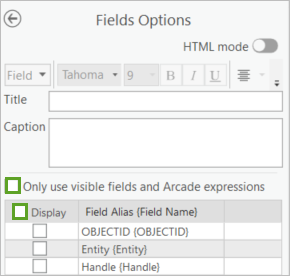
- In the Fields Options pane, uncheck the Only use visible fields and Arcade expressions box.
- Uncheck the Display box to unselect all the attribute fields.
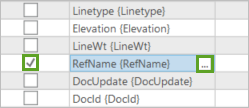
You'll select the RefName field and choose a more user-friendly label for it.
- Check the RefName {RefName} box . Point to the RefName{RefName} field name and click Format the field option.
The Pop-up Field Formatting pane appears listing the RefName attribute.
- For Display Label, type Name.
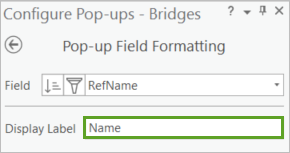
- Click the back button to go back to the Fields Options pane.
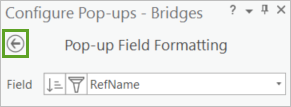
The RefName field label (or alias) is now updated.
- Click the back button to go back to the main Configure Pop-ups pane.
- On the scene, click a bridge to open the pop-up.
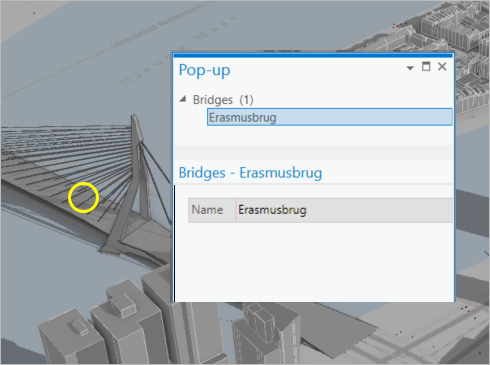
The pop-up now contains only the name of the bridge.
- Close the pop-up.
- Close the Configure Pop-ups pane.
- Press Ctrl+S to save the project.
In this section, you added the bridge layer to the scene and configured its pop-ups.
Add waste containers
Street furniture includes street lamps, trash bins, bus stops, public benches, and other small objects that are part of the urban landscape. They provide additional context to a planned construction project. Also, any construction project may impact existing street furniture or require purchase of new one. As such, it is useful to represent it in the scene. In this tutorial, you'll add two layers of street furniture layers. First, you'll add waste containers, and in the next section, you'll add street lamps.
A usual sight in the City of Rotterdam, the waste containers are partially underground receptacles where residents throw their domestic trash. Since the waste containers are of specific sizes and cannot be moved, they have been captured as a 3D multipatch feature class that represents their general shape.
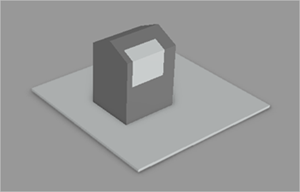
- In the Catalog pane, from the Rotterdam.gdb, add Waste_containers to the scene.
The Waste containers layer appears in the scene. As a 3D multipatch layer, each feature has a z-value that indicates at what vertical elevation it should be drawn. In the Contents pane, it is listed in the 3D Layers section.
You'll zoom in to view some of the containers.
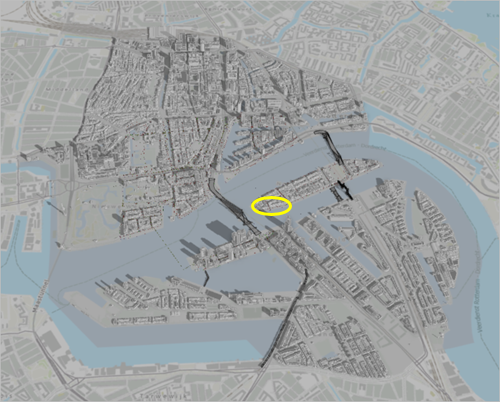
- Zoom in and pan to view to the southwest side of the Noordereiland island.
- Review the three containers on the Prins Henrikkade street.
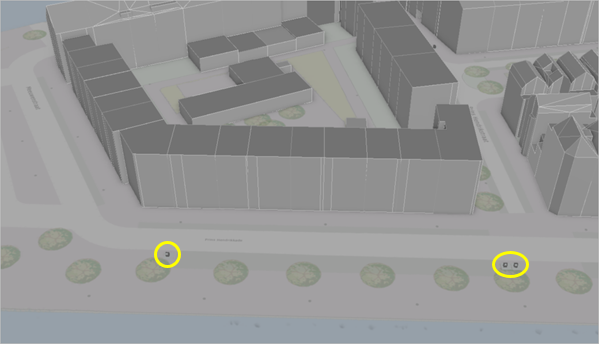
In this section, you added a first street furniture layer containing waste containers.
Add street lamps
Street lamps are the second type of street furniture you'll add to the scene. The Street lamps layer is a 2D point feature class: each street lamp is only represented by a point. You'll change its symbology to make the points appear as stylized 3D street lamps that harmonize well with the scene.
- In the Catalog pane, from the Rotterdam.gdb, add Street lamps to the scene.
The layer appears. In the Contents pane, it is listed under the 2D Layers category. In the scene, the features are drawn as flat dots positioned on the ground.
- Identify the flat Street lamps dots on the same view of southwest Noordereiland.
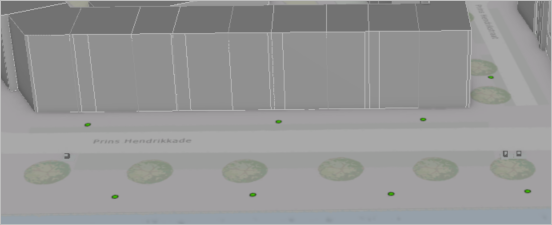
Note:
The color of the street lamp features is assigned at random and may vary.
There is no relevant information for your audience in the pop-ups, so you'll disable them.
- In the Contents pane, right-click the Street lamps layer and choose Disable Pop-ups.
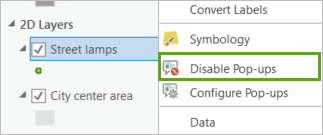
- On the map, click a street lamp dot, and verify that no pop-up displays for the street lamp.
You'll now change the symbology.
- In the Contents pane, drag the Street lamps layer to the 3D Layers category.
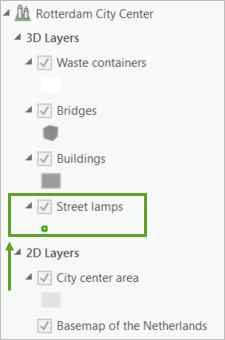
The features in the layer are now symbolized as small, round 3D shapes positioned on the ground.
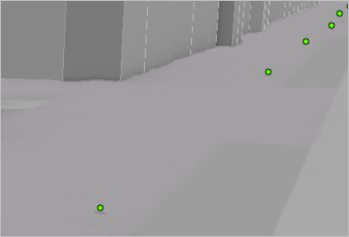
You'll now change this symbol with a 3D system style that represents a lamp post. ArcGIS provides many ready-to-use styles. First, you must add two style categories that you'll use in this tutorial.
- On the ribbon, on the Insert tab, in the Styles group, expand the Add drop-down list and choose Add System Style.

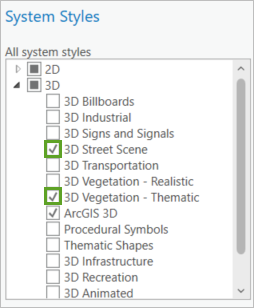
- In the System Styles window, expand the 3D section. Check the 3D Street Scene and 3D Vegetation – Thematic boxes.
- Click OK.
- In the Contents pane, right-click Street lamps and choose Symbology.
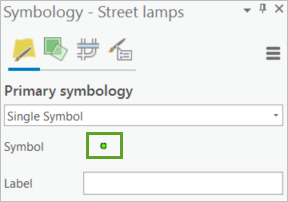
- In the Symbology pane, click the Symbol point to open the Format Point Symbol pane.
- Click the Gallery tab.
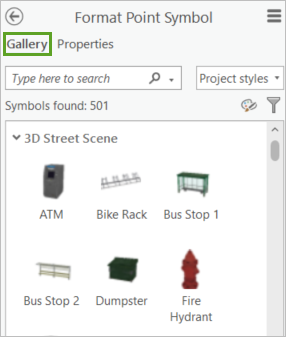
All the styles that you added earlier are listed in addition to the default styles.
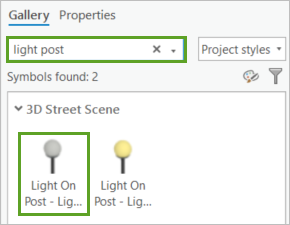
- In the search text box, type light post and press Enter. Click the Light On Post – Light Off symbol.
Tip:
You can hover over the symbols to see their full names.
On the scene, all the street lamp features update to that style. You want all the light posts to be represented with the correct height. To achieve that, you must define the symbol in real world units.
- In the Contents pane, right-click the Street lamps layer and choose Properties.
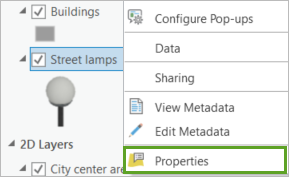
- In the Layer Properties window, under Display symbols in scene, click the Display tab and click Real-world units.
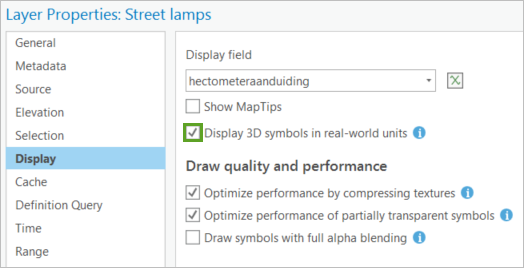
- Click OK.
You'll change the symbology for all lamp posts to appear as 6 meters high.
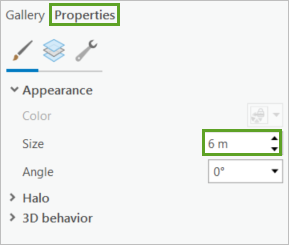
- In the Symbology pane, click the Properties tab and click the Symbol tab. Under Appearance, for Size, change the value to 6 m.
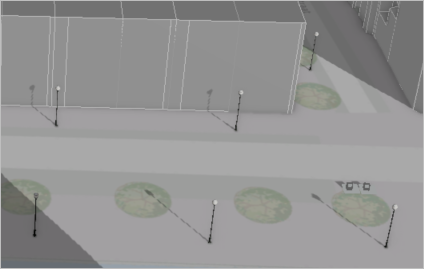
The street lamps now appear as being 6 meters high.
Note:
In reality, the height of 6 meters is only an average. The exact height of a light post depends on the distance to vegetation and other factors, and it can vary from city to city. Another option is to capture the actual height of each light post and store it as an attribute in the Street lamps feature class. You can then use the Vary the symbology by attribute functionality to display the exact size for each lamp post.
- Press Ctrl+S to save the project.
In this section, you added a second street furniture layer containing street lamps. Next, you will add trees.
Add trees
The tree population is an important aspect of a neighborhood's character. In most construction planning projects, it is important to visualize the trees around the project. You'll add a tree layer to the scene.
Note:
The Netherlands maintains a large tree inventory for the entire country, and that data is publicly available. The tree layer used in this tutorial is derived from that data.
- In the Catalog pane, from the Rotterdam.gdb, add Trees to the scene the scene.
The Trees layer appears. It is a 3D multipatch feature layer that displays the correct height of each tree based on a height attribute provided in the original data. The general shape of each tree is chosen based on its species.
- Explore the scene and observe how the presence of the trees adds character to the landscape.
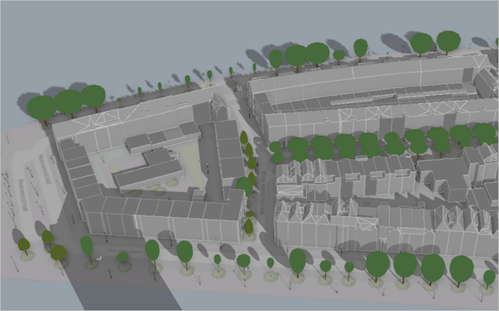
In this section, you added a tree layer. So far you added layers whose features were all above ground. Next, you'll add underground utilities.
Add underground utilities
Underground utilities, such as electricity and telecommunication cables or city heating pipes, can help your audience get a more complete picture of the city's infrastructure. Utilities are important in any construction project, because the planners must be aware of connection points to existing utilities. Also, damage to any of these elements during construction would be very costly.
You'll add a layer that represents diverse types of utilities in the ground.
Note:
This multipatch feature layer was generated by converting CAD data. It was then saved as a layer file (.lyrx), that includes the desired appearance: each utility type is represented with a specific color.
- In the Catalog pane, from the RotterdamCityCenter folder, add Utilities.lyrx to the scene.
The layer appears. You'll review the layer's symbology.
- In the Contents pane, right-click the Utilities layer and choose Symbology. In the Symbology pane, review the symbology parameters.
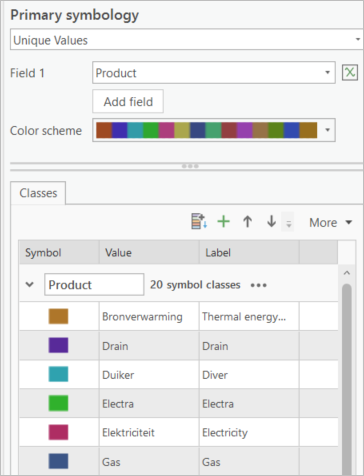
Primary Symbology is set to Unique Values, and the field symbolized is Product. Under Classes, in the table, you can see that each of the 20 Product types (or utility types) is symbolized with a different color. The labels have also been changed to English to make the layer understandable for non-Dutch speakers.
- Close the Symbology pane.
- In the Contents pane, if necessary, click the arrow next to Utilities to view the legend.
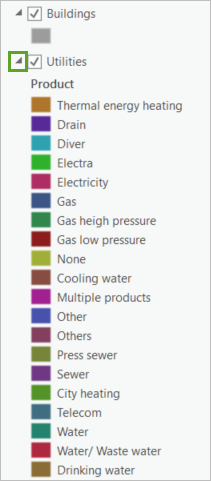
The same color-coded categories are listed with their English labels.
You'll now examine how the Utilities features appear in the scene. On the street level, you may see stormwater drains (in dark red). However, most of the utility features are located underground. To see them, you first must enable the camera to go underneath the ground, a capability that is turned off by default.
- In the Contents pane, under Elevation Surfaces, click Ground to select it.
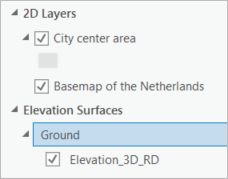
- On the ribbon, on the Elevation Surface Layer tab, in the Surface group, check the Navigate Underground box.

- Change the scene's view until you can see underground.
Tip:
You can press the middle mouse button and drag upward or use the Navigator.
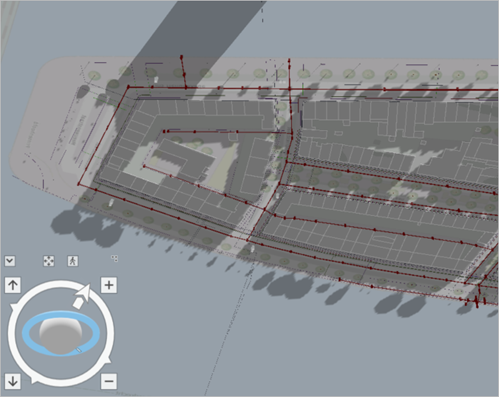
- Explore the underground area, consulting the legend to identify the types of utilities.
You can go above and under the ground to see how the utilities correspond to street level features.
- When you are finished, come back above ground.
- In the Contents pane, click the arrow next to Utilities to collapse the legend.
- Press Ctrl+S to save the project.
In this section, you added a Utilities layer.
Add a point cloud layer
Often during a construction project, sensor-based data, such as a lidar point cloud, is collected. A lidar point cloud provides millions of accurately positioned points indicating the relief of an area and the shape of the buildings and any other elements present in the landscape. Having access to such data in the scene can be useful. For instance, a construction company can visually analyze the position of features in the construction area and perform precise measurements.
You'll add a point cloud layer, which is stored in ArcGIS Online.
- In the Catalog pane, click the Portal tab, and choose ArcGIS Online.
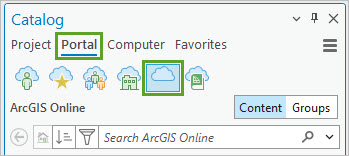
- In the search box, type or copy and paste PointCloud_RotterdamCityCenter owner: Esri_Tutorials.
- In the result list, right-click the PointCloud_RotterdamCityCenter scene layer and Add To Current Map or drag the layer into the scene.
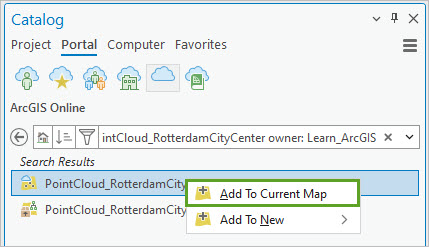
The layer appears in the scene.
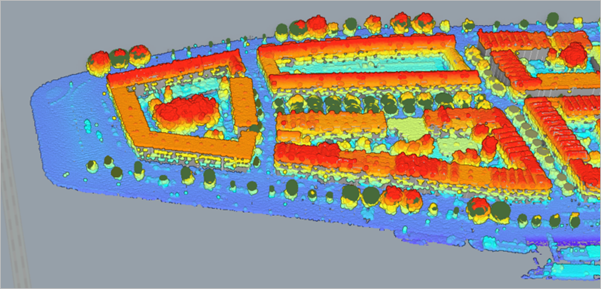
Navigate within the scene to see the different buildings, bridges, and street furniture displayed together with the point cloud layer.
You will notice that the point cloud matches many of the objects' shapes exactly. For the objects represented schematically in the scene (for instance, the trees), there may be more discrepancies. In the latter case, it is the point cloud that contains the most accurate information, whereas the 3D features are not fully realistic.
The point cloud scene layer contains dense information that is only relevant if users want to review the original sensor data. Therefore, you will keep it turned off by default. Users can turn it on as needed.
- In the Contents pane, uncheck the PointCloudRotterdam layer to turn it off.
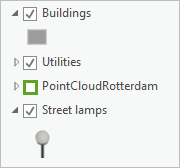
- Press Ctrl+S to save the project.
In this section, you added a point cloud to the scene.
Clip a layer to the area of interest
You have now added all the data layers to the scene. It is important to clip all this data exactly to the area of interest. This will reduce the amount of data you will need to share when you publish your scene, and therefore also reduce the credits needed in ArcGIS Online. For the purpose of this tutorial, you will only clip one layer: Street lamps. The other layers have already been clipped for you.
- In the scene, navigate to the south area, where the Buildings layer ends.
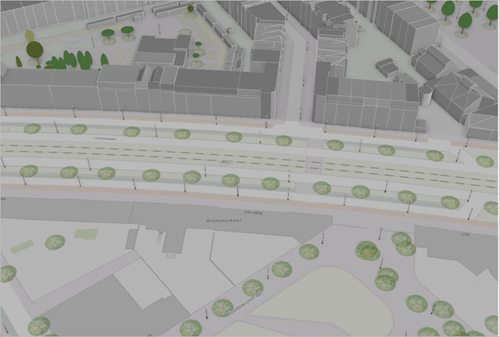
Observe that the street lamps are depicted beyond the area of interest.
- On the ribbon, on the Analysis tab, in the Geoprocessing group, click Tools to open the Geoprocessing pane.

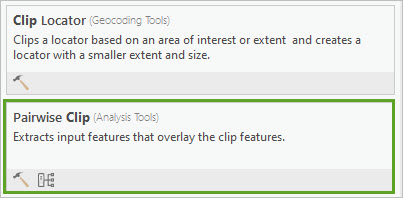
- In the Geoprocessing pane, in the search box, type clip. In the list of results, click the Pairwise Clip tool to open it.
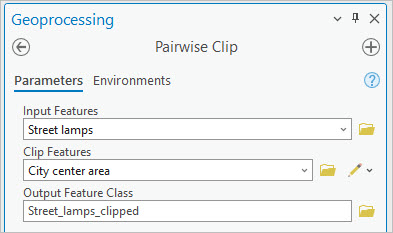
- Set the following Pairwise Clip parameters:
- For Input Features, choose Street lamps.
- For Clip Features, choose City center area.
- For Output Features or Dataset, click Browse. In the window, browse to RotterdamCityCenter > Rotterdam.gdb, for Name, type Street_lamps_clipped, and click OK.
- Click Run.
After the process is complete, the clipped layer appears. You'll remove the original Street lamps layer as you don't need it any longer.
- In the Contents pane, right-click Street lamps and choose Remove.
- Click the Street_lamps_clipped to select it and click it again to edit its name. Type Street lamps and press Enter.
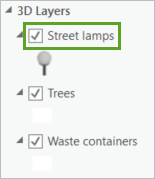
The clipped layer is renamed.
- In the scene, check that the street lamps outside of the area of interest are now gone.
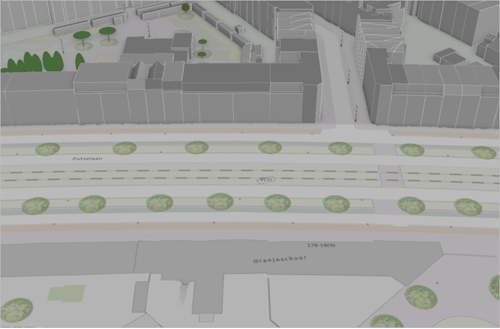
In this section, you clipped the Street lamps layer to the area of interest.
Inspect the scene and capture bookmarks
The scene is now complete. You'll inspect it and create bookmarks to help your audience navigate to relevant views.
- In the Contents pane, right-click the City center area layer and choose Zoom To Layer.
You can now see the entire scene.
- Zoom in, zoom out, pan, and tilt to inspect the overall scene.
You want to make sure that all layers draw correctly, that they harmonize well with each other in terms of appearance, and the scene is generally ready to be used as a backdrop for construction planning.
Note:
Fine-tuning a scene is an iterative process. If you discover issues or possible improvements, go back to editing the various aspects of the scene and layers.
For the purpose of this tutorial, you will consider yourself satisfied with the current state of the scene. You'll now create some bookmarks. First, you will create an overview bookmark to allow users to return to the scene's complete view.
- In the Contents pane, right-click the City center area layer and choose Zoom To Layer.
The camera position offers a top-down view of the area like the one in the following example image.
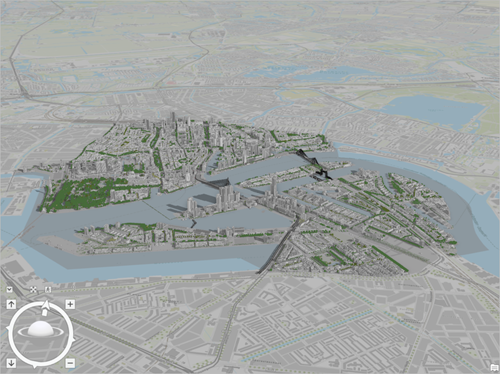
- Zoom, pan, and tilt to refine the camera position to your liking.
- When you are pleased with the view, on the ribbon, on the Map tab, in the Navigate group, click Bookmarks to expand it and choose New Bookmark.
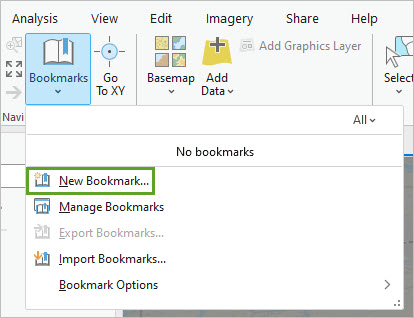
- In the Create Bookmark window, for Name, type Overview. For Description, type City center of Rotterdam.
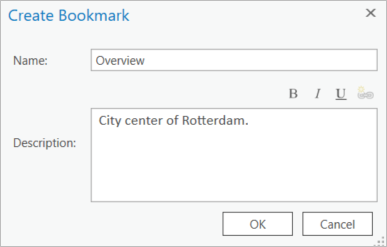
- Click OK.
Next, you'll create bookmarks with a focus on the Noordereiland neighborhood.
- Zoom in to the island and choose a view resembling the following example image.
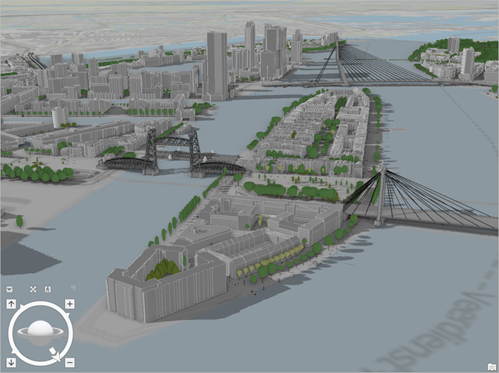
- When you are finished, create a bookmark named Noordereiland and described as Noordereiland neighborhood in Rotterdam.
You'll now create a bookmark showing the utilities layer under the ground of the Noordereiland neighborhood.
- Navigate underground, under the Noordereiland island, and choose a view that shows a portion of the utilities, such as in the following example image.
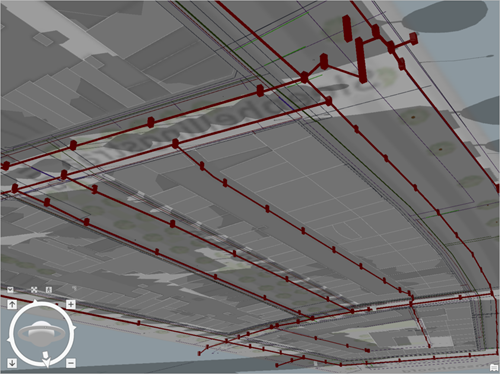
- Create a bookmark named Noordereiland underground and described as Utilities.
You'll now test the bookmarks you created.
- On the ribbon, on the Map tab, click Bookmarks, and choose the Overview bookmark.
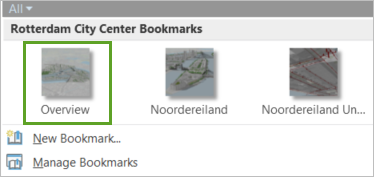
The camera navigates to the bookmarked view.
- Similarly, navigate to other bookmarked views.
- Optionally, create bookmarks for other interesting locations in the scene.
- Press Ctrl+S to save the project.
You have authored a comprehensive scene that includes many data layers relevant for construction planning. Next, you will share that scene in ArcGIS Online.
Share the scene to ArcGIS online
Currently, the scene you've built exists only on your computer, as an ArcGIS Pro project. You'll now publish it as a web scene to ArcGIS Online and make it public. This allows your audience to view the scene in their web browser. Architects and construction companies can also save a copy of the web scene and add content to it. It will save them time and money, as the scene will already have the correct coordinate system and all the base data layers.
Share the scene
You'll set up the scene for sharing, provide all the information needed, set up the configuration options, and publish the scene to ArcGIS Online.
First, you'll ensure the layers and view are set up as you want them to be published.
- In the Contents pane, make sure that all layers are turned on except the point cloud layer.
- On the ribbon, on the Map tab, click Bookmarks, and choose the Overview bookmark.
Next, you'll enter the information for the new web scene.
- On the ribbon, on the Share tab, in the Share As group, click Web Scene.
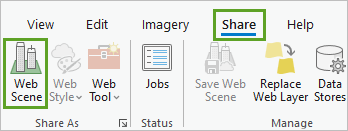
The Share As Web Scene pane appears.
- In the Share As Web Scene pane, for Name, accept the default name of Rotterdam City Center and add your initials to the end.
Note:
As you create the web scene, you need to make sure its name and the names of its components are unique across your organization. One way to achieve that is by adding your initials at the end of the scene name. However, you should adapt this to your own name. For instance, if your name is Jane Smith, your initials will be JS.
- For Summary, type Scene built in the Esri tutorial Create a web scene to support construction planning.
- For Tags, type Rotterdam, The Netherlands, Esri tutorial, Construction, Planning, BIM and press Enter.
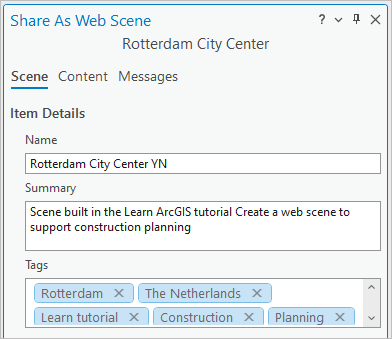
- Under Location, for Folder, accept the default, choose a destination folder in your ArcGIS Online account, or create a new one.
- For Share with, check Everyone.
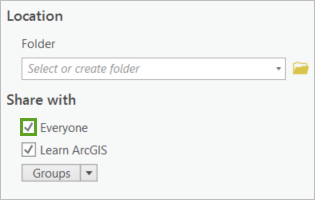
This will make the web scene available publicly without restriction. If you prefer keeping your scene available only to your organization, you can check Organization instead.
- Click the Content tab.
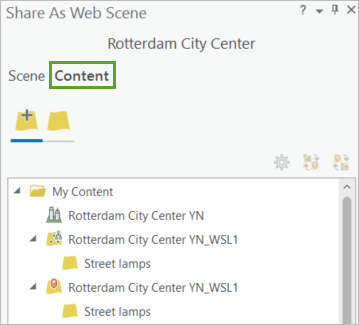
A list of layers that must be created for the web scene appears.
Web layers must be created and published to ArcGIS Online for all the data that currently exists only on your desktop computer (Street lamps, Bridges, Buildings, Utilities, City center area , Waste Containers, and Trees). Layers that are already hosted on ArcGIS Online (basemap, elevation, and point cloud layers) are ready and do not need further processing.
- Point to the first occurrence of Rotterdam City Center_YN_WSL1.
A pop-up states that this will be a web scene layer.

- Hover over the second occurrence of Rotterdam City Center_YN_WSL1.
A pop-up states that this will be a web feature layer. Currently, both the web scene layer and web feature layer will be created on ArcGIS Online to represent the Street lamps in the scene.
You will share the layer to ArcGIS Online with minimal use of credits. You'll change the layer configurations to create as much of the content as possible on your computer and only publish the end result to ArcGIS Online. This saves the cost of performing data creation in ArcGIS Online. For more information about usage of credits in ArcGIS Online, see Understand credits in ArcGIS Online.
With the new configuration, you do not need to create a web feature layer on ArcGIS Online. Instead, a scene layer package will be created locally and uploaded later to ArcGIS Online.
- On the Content tab, click the Rotterdam City Center_YN_WSL1 web scene layer to select it, and click Configure Web Layer Properties.
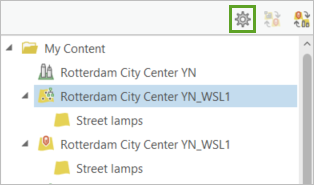
The Configure Rotterdam City Center_YN_WSL1 web layer pane appears.
- In the Configure Rotterdam City Center_YN_WSL1 web layer pane, click Configuration.
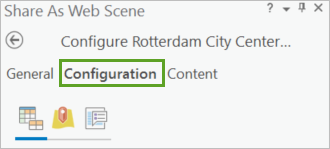
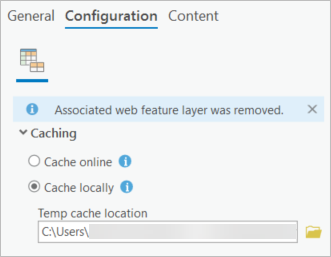
- Choose Cache locally and accept the default temp cache location.
The scene layer package will be created in this local folder. The message Associated web feature layer was removed appears.
- Click the back button.

- In the Content list, point to the second occurrence of Rotterdam City Center_YN_WSL1.
The pop-up states that this will now be a scene layer package (not a web feature layer).
- Repeat the same configuration change for the other five web scene layers listed, so that the Cache locally option is used for all of them.
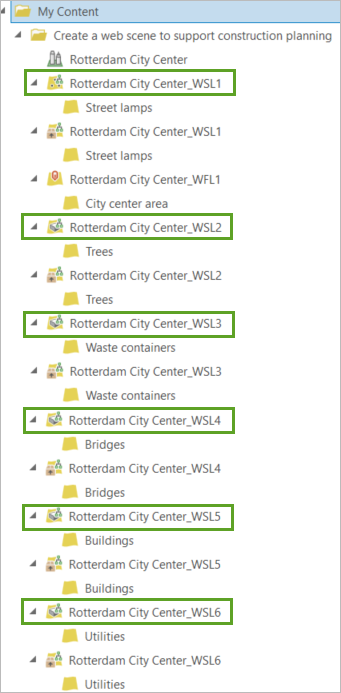
When you are finished, the content listed is only web scene layers and scene layer packages. The one exception is the Rotterdam City Center_WFL1 layer (for City center area) is a 2D layer that will be published as a web feature layer. (There are no caching options for that layer.)
You'll now analyze the web scene to verify that there aren't any remaining issues that you need to address.
- In the Share As Web Scene pane, under Finish Sharing, click Analyze.

The Messages tab appears. Any warnings or errors that must be addressed are listed there. Warnings have a yellow icon and errors have a red icon. You can still share with warnings, but errors must be resolved before sharing. In this case, there is an error that you will resolve regarding the Shape_Length field being used as a display field.
- In the Contents pane, open the properties for the City center area layer.
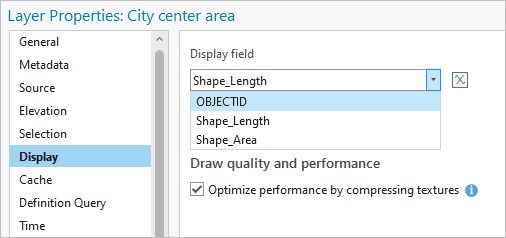
- Click the Display tab. For Display field, click the drop-down menu and choose OBJECTID.
- Click OK. In the Share As Web Scene pane, click Analyze.
The error is resolved and you can continue sharing the web scene.
Note:
This operation uses some credits and can take 10 minutes or more, since a lot of data will be prepared and shared. You can skip this step and continue the tutorial with this ready-made scene.
- Under Finish Sharing, click Share.

Tip:
Optionally, you can monitor progress in more detail by clicking Jobs under Finish Sharing. The Job Status pane appears, listing the layers that are currently being processed.
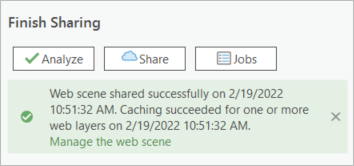
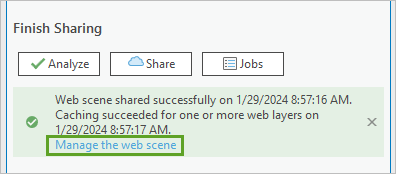
When the process is complete, in the Shade As Web Scene pane, a green message box appears, informing you that the web scene was shared successful.
- Press Ctrl+S to save the project.
In this section, you published the scene to ArcGIS Online.
View the web scene in ArcGIS Online
Now that the Rotterdam City Center scene is published to ArcGIS Online, you'll inspect it.
- In the message box, click the Manage the web scene link to open the web scene in a web browser.
Note:
If you would like to explore the ready-made scene instead, go to its item page.
The item page for the web scene appears in your default web browser. It lists all the information about the scene, including the list of layers it includes.
- Click Open in Scene Viewer.
The web scene appears.
- Explore the web scene.
Note:
Use the mouse wheel button to zoom, click the left mouse button and drag to pan, and click the right mouse button and drag to rotate and tilt.
Alternatively, you can also use the navigation buttons below the Home button to achieve the same movements.
It is similar in content and appearance to the original scene you built in ArcGIS Pro.
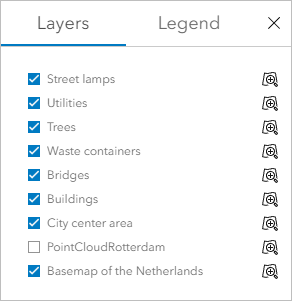
- In the Layers pane, turn some of the layers on and off.
- Hover over the ribbon at the bottom of the scene, and click some of the slides (or bookmarks).

The camera navigates smoothly from one view to the other.
You have access to a variety of other tools. For instance, you can change the illumination of the scene based on the time of day.
- On the side toolbar, click the Daylight/Weather button.

- In the Daylight window, move the time slider to change the time of the day and see the corresponding illumination in the scene.
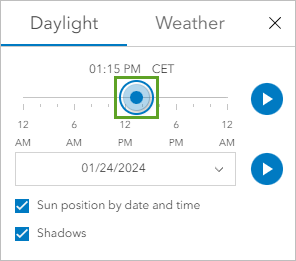
You can also perform measurements.
- On the toolbar, click the Scene tools button.

- In the Scene tools window, check that the Measure distance tool is selected.
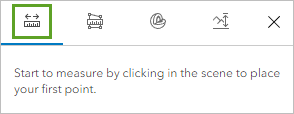
- Zoom in to a building of interest, click an edge of its roof and then click a second corner.
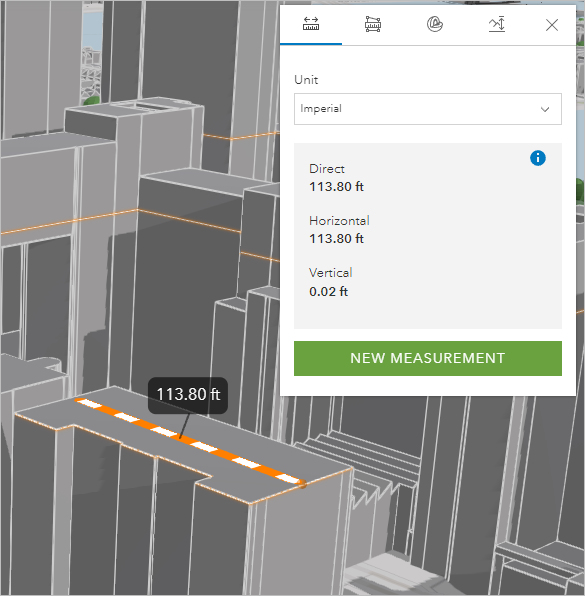
In the Scene tools window, its measurement appears.
- Close the Scene tools window.
You can learn about more web scene tools and options in the Get started with Scene Viewer documentation.
In this tutorial, you published a 3D web scene to be used as a backdrop for planned construction projects in the City of Rotterdam. You can learn about adding planned projects to the scene in upcoming tutorials.
The scene allows companies and organizations to share valuable information about any planning projects in the city. It also allows citizens to learn about the projects early on in an engaging manner. Finally, because you provided the data layers that populate the scene, you control the data flow and maintenance and can keep the scene up-to-date over the long term.
You can find more tutorials like this in the BIM and GIS learning path.

