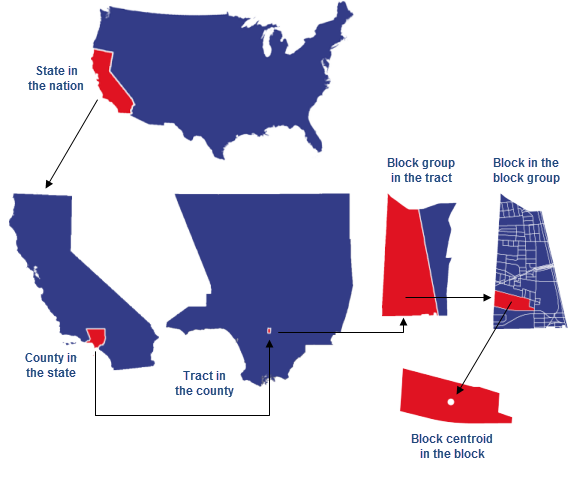
The United States Census Bureau reports data by various political and statistical geographic units. The top-to-bottom relationship shown here represents a statistical hierarchy of containment: the nation contains states, states contain counties, counties contain tracts, tracts contain block groups, and block groups contain blocks. Many other non-nesting reporting units are not shown.
Census tracts are statistical subdivisions of a county that aim to have roughly 4,000 inhabitants. Tract boundaries are usually visible features, such as roads or rivers, but they can also follow the boundaries of national parks, military reservations, or American Indian reservations. Tracts are designed to be fairly homogeneous with respect to demographic and economic conditions when they are first established. When a census tract experiences growth and the internal population grows beyond 8,000 persons, the tract is split up. This review and revision process is conducted every decade with collaboration from local planning agencies.
A block group is a subdivision of a census tract and contains a cluster of blocks. Block groups usually have between 250 and 550 housing units.
A census block is the smallest geographic census unit. Blocks can be bounded by visible features—such as streets—or by invisible boundaries, such as city limits. Census blocks are often the same as ordinary city blocks. Census blocks change every decade.
Census data may be provided in the form of boundaries (polygons) or centroids (points). A centroid is a point located in the geographic center of the polygon it represents, and containing the same attributes. For example, a block centroid contains the same information as the block polygon.
The Census Bureau conducts a new census every 10 years. The latest one was conducted in 2020. Professional demographers estimate values for the intervening years.
You can read more in the United States Census Bureau's Geographic Areas Reference Manual.