A GIS represents both features and surfaces. Features are geographic objects with well-defined shapes (such as political boundaries). Surfaces are geographic phenomena with values at every point across their extent. Elevation is a common example, but surfaces can also represent temperature, chemical concentrations, and many other things.
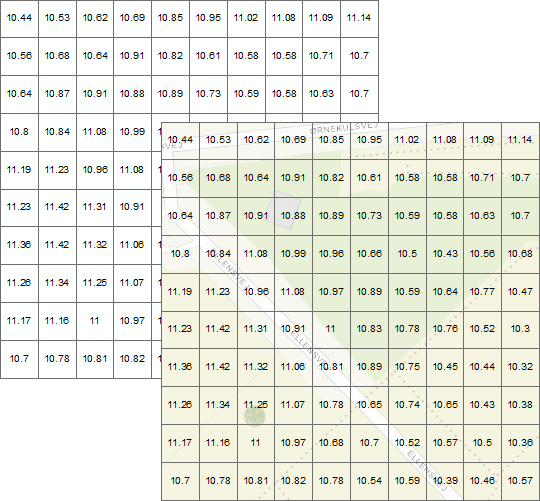
Surfaces are usually modeled with raster datasets. A raster is a matrix of cells, also called pixels, organized in rows and columns and covering some part of the world (or even the whole world). Each cell in the matrix represents a square unit of area and contains a numeric value that is a measurement or estimate for that location.

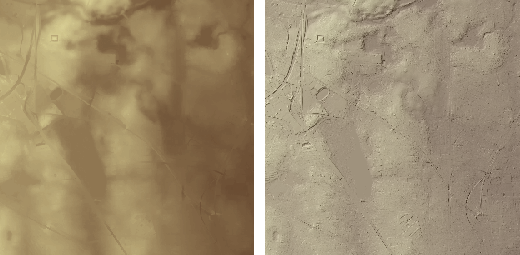
When you look at a Digital Elevation Model (DEM) on a map, you don't see a cell matrix. Instead, you see a layer symbolized by a color ramp, as in the left image below. Special effects, such as hillshading, may be used to simulate relief, as in the right image below.

Analysis tools can be run on DEMs to produce new surfaces such as slope and aspect. DEMs can also be used to study surface properties such as visibility and water flow. For more information on DEMs, see the ArcMap help topics What is raster data? and Surface creation and analysis.