Prevent peak load spikes using constraint attribute rules
First, you'll create two attribute rules to enforce and report on data integrity in ArcGIS Utility Network. Then, you'll use Arcade to configure and test new pop-up expressions that will derive useful information from the log you created through the calculation rule. You'll learn how to do the following:
- Create a constraint rule to prevent spikes with peak load.
- Create an associated calculation rule to report peak load values when edits are made to low-voltage service features.
- Test the attribute rules by editing low-voltage service features and reviewing the output of each rule.
- Configure a pop-up using Arcade to derive useful information from the log you created using the calculation rule.
Explore subtypes
In the utility network, irregular attribute edits were observed on features of the Low Voltage Service asset group. However, if you open the Electric Network Editor map or review feature classes in the UtilityNetwork feature dataset in the geodatabase containing your utility network to identify the irregularities, you may notice that a Low Voltage Service feature class is not available.
The feature class is not available because the ArcGIS Utility Network implements a classification model using subtype group layers and attribute domains, which reduces the need for a large number of individual feature classes. In addition, in the Contents pane of the map, composite layers are used to group related utility network layers. These composite layers function more efficiently than individual layers by reducing the number of requests made to the data source when layers are queried, edited, or refreshed.
First, you'll download the data and explore the subtypes for a feature class in the UtilityNetwork feature dataset.
- Download the Attribute rules in the ArcGIS Utility Network project package.
- Locate the Attribute_rules_in_the_ArcGIS_Utility_Network_ project package on your computer. Move the file to a suitable location, if necessary, and double-click it.
The Use Attribute Rules project opens in ArcGIS Pro.
Note:
If you don't have access to ArcGIS Pro or an ArcGIS organizational account, see options for software access.
The project has no map, currently. For now, you'll work with the data from the Catalog pane.
- In the Catalog pane, expand Databases and expand electricnetworkeditor.gdb.
Note:
If the Catalog pane is not visible, on the ribbon, click the View tab. In the Windows group, click Catalog Pane.
- Under electricnetworkeditor.gdb, expand the UtilityNetwork feature dataset.
The feature classes and relationship classes organized in the feature dataset represent the schema (structure) of the geodatabase containing the utility network.
- In the Catalog pane, right-click ElectricDevice, point to Data Design, and choose Subtypes.
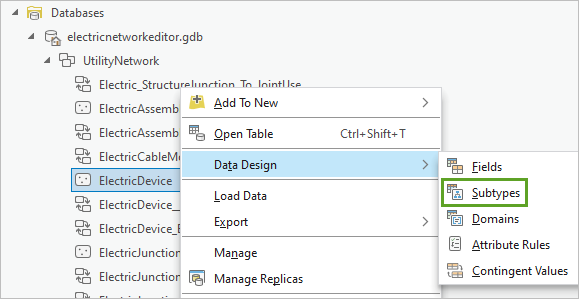
The Subtypes view for the ElectricDevice feature class appears. The feature class already has several subtypes and related domains applied.
- In the Subtypes view, review the *ASSETGROUP subtype.
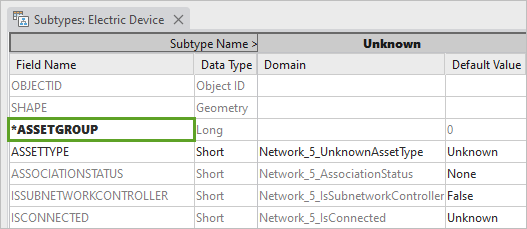
*ASSETGROUP is a subtype used to define various types of assets, such as a high-voltage arrester, low-voltage switch, low-voltage arrester, and low-voltage service. In addition, ASSETTYPE provides a mechanism to define a level of subclassification for an asset. For example, the Low Voltage Service is subclassified as Single Phase Residential and Three Phase Commercial.
- Scroll to the Low Voltage Service column corresponding to *ASSETGROUP 22.

For the Low Voltage Service subtype, many fields have domains assigned and some fields have default values set. These enforce data integrity (valid values) by limiting updates to a specific list of choices or a range of values. If no value is provided, the default is used.
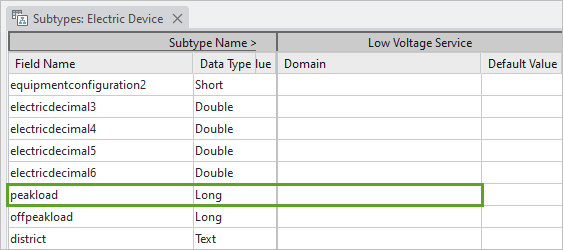
- For *ASSETGROUP 22, scroll down to the peakload field.
The peakload field does not have a domain assigned.
Note:
Peak load (or peak demand) can fluctuate many times on a daily cycle and its values can vary between services. As a result, default values and domains are not effective tools to maintain data integrity for this attribute. A solution is to author a constraint attribute rule using the Arcade global $originalFeature in the attribute rules profile that will detect large changes assigned to the peakload attribute. The $originalFeature Arcade global presents the state of the feature before the edit, giving the script author flexibility to compare the current values of $feature with the original values of the feature.
While peak load can change on a daily basis, the value range is generally consistent day to day and should only reflect broad changes on a monthly or seasonal basis. Using a new constraint rule applied to the peakload field will trigger an edit to fail when a change to the field is too large. Later, you'll enhance this error detection by creating a calculation attribute rule to populate a row in a table to log the changes made to the peakload field.
- Close the Subtypes view.
Add a constraint attribute rule
Next, you'll add an attribute rule. Attribute rules enhance the editing experience and improve data integrity for geodatabase datasets. They are user-defined rules that can be used to automatically populate attributes, restrict invalid edits during edit operations, and perform quality assurance checks on existing features.
Attribute rules are complementary to existing rules used in the geodatabase, such as domains and subtypes. For example, domains can be assigned to an attribute field to aid in the data collection process by providing a pick list of valid values for editors. To enhance this behavior, an attribute rule can be used to restrict values for an attribute field that are not part of the domain when performing a field calculation. After rules are added to a dataset, they can be evaluated as edits take place or at a later time.
It's important to note that attribute rules are not specific ArcGIS Utility Network functionality but can be deployed across all geodatabase feature classes and tables to perform edit operations, data validation, quality assurance, and operations.
- In the Catalog pane, right-click ElectricDevice, point to Data Design, and choose Attribute Rules.
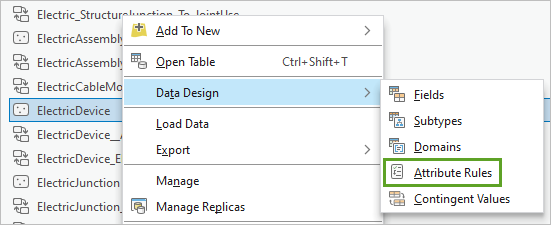
The Attribute Rules view opens. This view contains three tabs identifying different rule types: Calculation, Constraint, and Validation.
- In the Attribute Rules view for Calculation rules, scroll to Rule Name ID_Device_22 representing the Low Voltage Service feature.
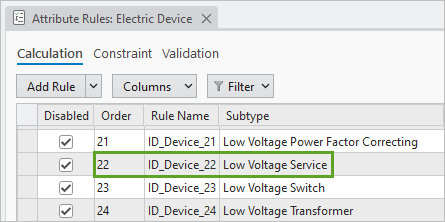
- Click the rule to select it. In the ID_Device_22 pane, review the Expression and Triggers sections.
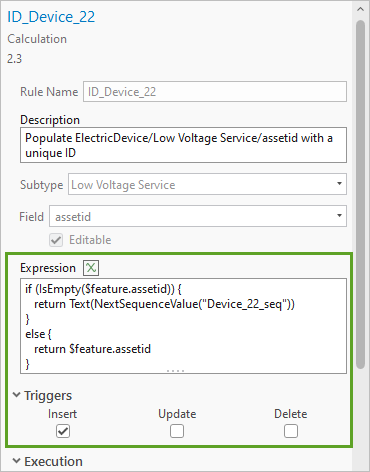
When this expression is applied during insertion of a new Low Voltage Service feature, it populates the assetid field with a unique ID value.
Next, you'll add a new constraint rule to cause edits to fail if the peak load value is modified by a factor of more than 50. Constraint rules specify permissible attribute configurations and general relationships on a feature. These prevent invalid data entry during edit operations to ensure data integrity. Constraint rules can be created for datasets in both file and enterprise geodatabases using the Add Attribute Rule and Import Attribute Rules geoprocessing tools or in the Attribute Rules view.
- In the Attribute Rules view, click the Constraint tab and click Add Rule.
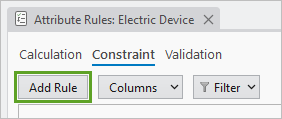
The New Rule pane appears. No constraint rules are defined yet.
Next, you'll update the rule properties to create a constraint rule for the ElectricDevice feature class.
- In the New Rule pane, enter the following parameters:
- For Rule Name, type Prevent load spikes.
- For Description, type If the peak load attribute is changed by a factor of more than 50, fail the edit.
- For Subtype, uncheck All and check Low Voltage Service.
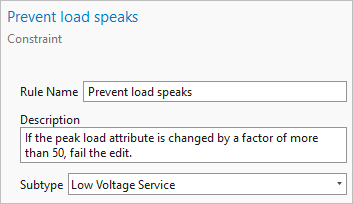
You selected the Low Voltage Service subtype because you want this attribute rule to execute only when edits are made to service meters of this subtype.
- For Expression, click the Expression button.
- In the Expression Builder window, in the Expression text box, copy and paste the following code:
var dLoad = $feature.peakload - $originalFeature.peakload;
if (dLoad > 50)
    return false;
else
    return true;
- Click the Verify button to validate the expression.
The expression is valid.
- Click OK.
Note:
The Arcade global $originalFeature provides the state of the feature before it was edited. For example, if the current value of peakload for a feature is 10, and you update the value to 20, $originalFeature.peakload will return 10 and $feature.peakLoad will return 20.
Next, you'll continue updating rule properties.
- In the Triggers section, check the Update box. In the Execution section, check the Exclude from application evaluation box.
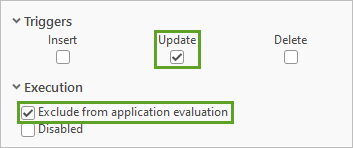
- In the Error section, set the following parameters:
- For Error Number, type 1001.
- For Error Message, type Load spike detected, aborting edit.
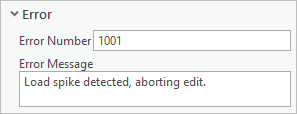
- On the ribbon, on the Attribute Rules tab, in the Manage Edits group, click Save.

Note:
It may take several minutes for the rule to save.
- Close the Attribute Rules view.
- On the Quick Access Toolbar, click the Save Project button.

Test the constraint rule
To test the new constraint rule you just created, you need to update a low-voltage service and edit the peak load.
- In the Catalog pane, expand Maps.
- Right-click the Electric Network Editor map and choose Open.
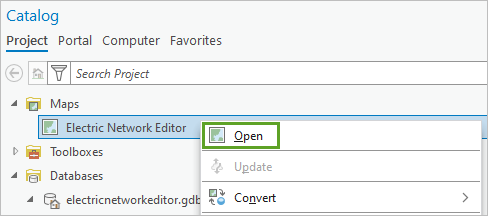
The Electric Network Editor map appears.
- On the ribbon, on the Map tab, in the Navigate group, click Bookmarks and choose Test Attribute Rule.
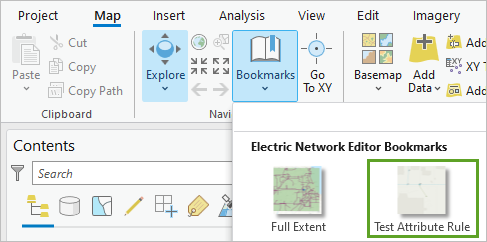
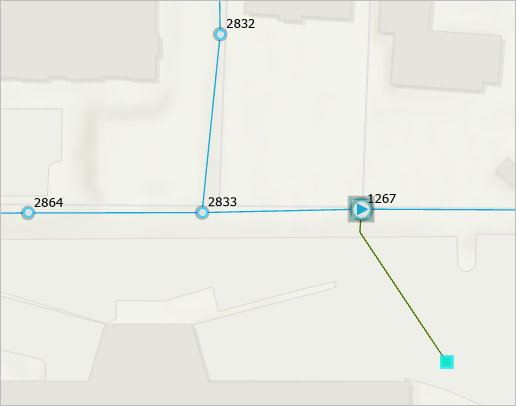
The map extent updates and centers on a low-voltage service point located south of Beebe Elementary School.
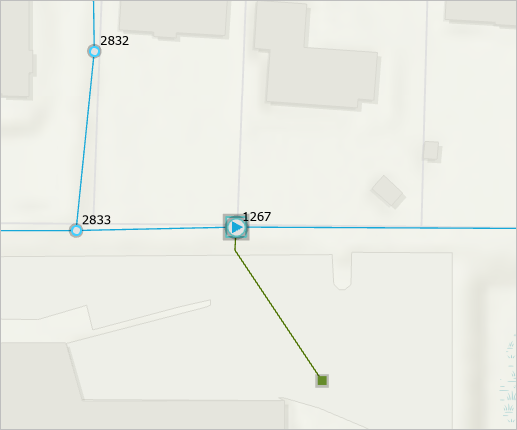
- On the ribbon, in the Selection group, click the Select button.

- On the map, click the low-voltage service point.
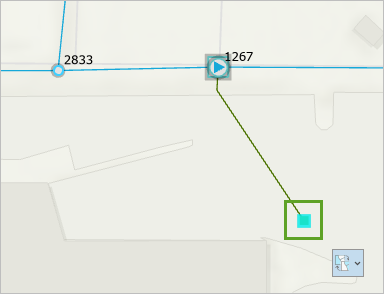
The feature highlights in blue, indicating it is selected.
- On the ribbon, in the Selection group, click Attributes.
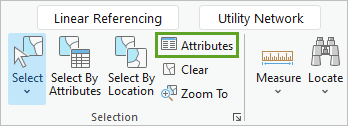
The Attributes pane appears.
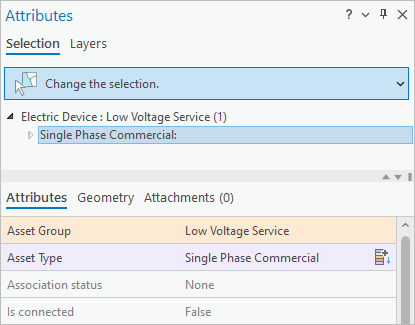
- At the bottom of the Attributes pane, confirm that Auto Apply is enabled.

This parameter ensures that edits to the feature are automatically applied.
- Scroll to the Peak Load (kW) attribute. Click <Null>, type 10, and press Enter.
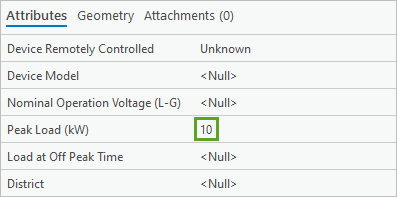
The Peak Load (kW) attribute is updated for the feature, and no warning is expected since the constraint rule applied to this field is triggered only when the value exceeds 50 kW.
- For Peak Load (kW), type 70 and press Enter.
The updated Peak Load (kW) value of 70 triggers the edit to fail and an error message displays in the Attributes pane.
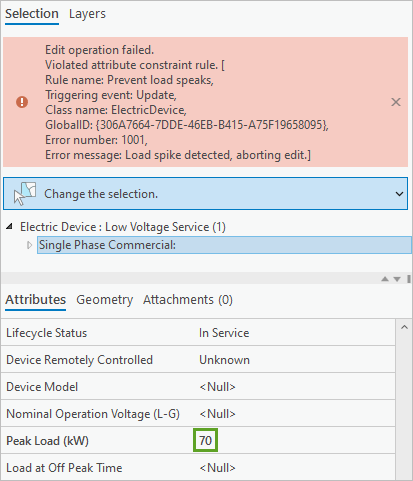
The edit failure and the error message were triggered because the Peak Load (kW) value increased by more than 50 kW. This was a result of the constraint rule applied to the ElectricDevice features.
Note:
In the constraint rule expression, the initial $originalFeature value was set to 0. Updating it to 10 did not trigger the constraint because 10 - 0 = 10, which is less than 50. Updating the value to 70, however, triggered the attribute rule and caused the failure because 70 - 10 = 60, which is greater than the threshold value of 50.
- Test your constraint rule by experimenting with different values for the Peak Load (kW) attribute.
Tip:
Try editing the Prevent load spikes rule to prevent an error. Use the Abs() function in Arcade.
If you lower the Peak Load (kW) value by more than 50, the error does not occur.
For the purpose of this tutorial, you won't keep the edits made to Peak Load (kW).
- On the ribbon, click the Edit tab. In the Manage Edits group, click Discard.

- In the Discard Edits window, click Yes.
Your edits are discarded.
- Close the Electric Network Editor map. Save the project.
You've authored a constraint attribute rule using the Arcade global $originalFeature to detect large changes made to the peakload attribute.
Report peak load spikes using a calculation report
Previously, you authored a constraint attribute rule using the Arcade global $originalFeature to detect large changes made to the Peak Load attribute. Next, you'll create a calculation rule to report the peak load value when low-voltage services are updated. The calculation attribute rule will detect a change in the service point load history and log this information in a separate table.
Create a load history table
First, you'll create a table in the electricnetworkeditor geodatabase to log the changes in service point load history.
- In the Catalog pane, under Databases, right-click electricnetworkeditor.gdb, point to New, and choose Table.

The Create Table wizard appears.
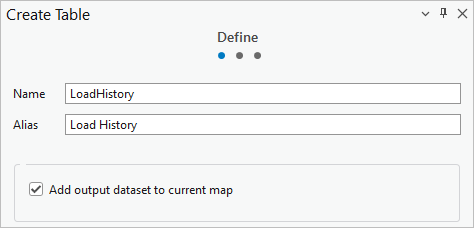
- In the Create Table wizard, on the Define page, enter the following information:
- For Name, type LoadHistory.
- For Alias, type Load History.
- Click Next.
Next, you'll add two fields to the table.
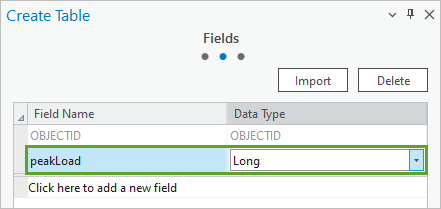
- On the Fields page, click Click here to add a new field and enter the following information:
- For Field Name, type peakLoad.
- For Data Type, choose Long.
- Click Click here to add a new field to add the second field with the following parameters:
- For Field Name, type serviceGUID.
- For Data Type, choose GUID

To track which services were edited, the peakLoad field will store the load of the service point and the serviceGUID field will store the GUID of the updated service point.
- Click Finish to create the new table.
Next, you'll enable editor tracking on the LoadHistory table to log and identify who edits the table and when edits are made.
- In the Catalog pane, right-click the LoadHistory table and choose Manage.
- In the Table Properties window, check Editor Tracking.

Fields that support editor tracking are added to the table.
- Click OK to close the Table Properties window.
- In the Catalog pane, right-click LoadHistory, point to Data Design, and choose Fields.
The Fields view for the table appears.
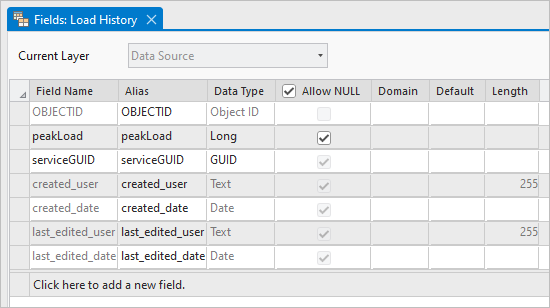
The fields that were added to support editor tracking include a global user identifier and fields to identify the user who generated and edited the feature and the date the edits were made.
- Close the Fields view.
Create a calculation attribute rule
Next, you'll create a calculation attribute rule that detects a change in the service point load history and logs this information in a separate table. Calculation attribute rules are used to automatically populate attribute configurations on a feature.
- In the Catalog pane, expand the UtilityNetwork feature dataset.
- Right-click the ElectricDevice class, point to Data Design, and choose Attribute Rules.
The Attribute Rules view appears.
- If necessary, in the Attribute Rules view, click the Calculation tab.
There are several existing calculation rules. These were created during the initial configuration of the utility network and are used to maintain data integrity.
- Click the Add Rule drop-down arrow and choose Immediate Calculation.
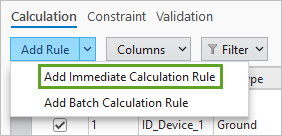
The New Rule pane appears.
Immediate calculation rules are automatically evaluated and triggered by edit operations such as insert, update, and delete. You'll create a rule that is triggered by insert and update operations.
- In the New Rule pane, enter the following parameters:
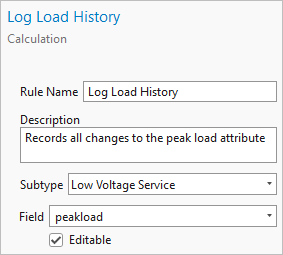
- For Rule Name, type Log Load History.
- For Description, type Records all changes to the peak load attribute.
- For Subtype, uncheck All and check the box for Low Voltage Service.
- For Field, choose peakload.
Updating the Rule Name field updates the pane title to Log Load History.
- For Expression, click the Expression button.
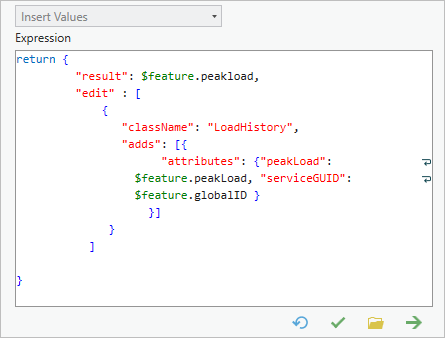
- In the Expression Builder window, for Expression, enter the following Arcade expression:
return {
         "result": $feature.peakload,
         "edit" : [
             {
                "className": "LoadHistory",
                "adds": [{
                      "attributes": {"peakLoad": $feature.peakLoad, "serviceGUID": $feature.globalID }
                    }]
              }
           ]

}
Note:
This script uses an edit dictionary return type, which is a special dictionary (in JSON format) that includes the following properties:
- "result"—Represents what you want to return as the peak load of the feature you are editing. In this example, you are not altering the result. You want to return the current peakload value for the edited service feature and update the field with the same name in the LoadHistory table.
- "edit"—Represents an array of edits that you want to make because of the initial edit. In this example, you want to edit the className field of the LoadHistory table by performing a series of "adds" functions with specified attributes.
- Click the Verify button to validate the script. After the expression is verified, click OK.
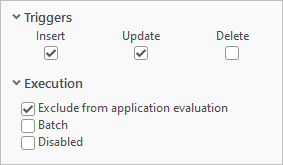
- In the Log Load History pane, under Triggers, check the Insert and Update boxes.
- Under Execution, check the Exclude from application evaluation box.
- On the ribbon, on the Attribute Rules tab, in the Attribute Rules group, click Save.
Note:
It may take several minutes for the rule to save.
- Close the Attribute Rules view and save the project.
Test the calculation rule
To test the immediate calculation attribute rule you just created, you'll update a low-voltage service by editing the peakload attribute. Then, you'll confirm that the edit was applied to the LoadHistory table through the calculation rule.
- In the Catalog pane, under Maps, double-click the Electric Network Editor map.
The Electric Network Editor map appears.
- If necessary, navigate to the Test Attribute Rule bookmark and select the low-voltage service feature you used for testing previously.
- On the Map tab, in the Selection group, click Attributes.
- In the Attributes pane, confirm that the selected feature has a Global ID value of {306A7664-7DDE-46EB-B415-A75F19658095}.

- If necessary, check the Auto Apply box to automatically commit edits.
- For Peak Load (kW), type 10 and press Enter.
As you update the Peak Load (kW) values, the new attribute rule is generating records in the LoadHistory table to track edits made to the low-voltage service points.
- For Peak Load (kW), type 30, and press Enter.
- In the Contents pane, under Standalone Tables, right-click the LoadHistory table and choose Open.

The table has two rows representing the updates made to the peakLoad attribute. These were generated as a result of the calculation rule you created. In addition, the table includes fields containing details about the editor and the dates and times the edits were made.
- Edit the Peak Load (kW) attribute for the low-voltage service point feature a few more times and confirm that the LoadHistory table updates by refreshing the table after making an edit.
The current calculation rule configured for low-voltage service points adds a new row to the table each time a point is edited. Your new calculation rule will track every edit that occurs for the peak load of the Low Voltage Service asset group. Using the $originalFeature global, you can, for example, configure the rule to generate a log value only when the peakLoad attribute is changed.
- Close the table. Save the project.
Note:
In a real-world scenario, it is likely that the load information for these services updates in an automated fashion. The constraint rule you created may prevent abnormal value spikes from entering the system by raising errors if this occurs.
Your calculation rule automates the reporting of these values and provides insight into customer operational patterns and trends. Use the LoadHistory table to share this information with engineers and operations team members and to provide a resource for additional analysis if abnormal values indicate a problem.
You can also use the LoadHistory table to provide similar analyses to your customer service staff and field crew. In this way, spatial feedback can be used when assisting customers with billing calls or inspecting devices in the field during service calls.
Next, you'll configure pop-ups to present information derived from the LoadHistory table to provide spatial feedback and assist your customer service staff and field crew when assisting customers with billing calls or inspecting devices in the field during service calls, respectively. This can provide context to the history of the service for those using this data.
Configure a pop-up to display load history
Previously, you created a calculation rule to report the peak load value when low-voltage services were updated. A calculation attribute rule detected a change in the service point load history and logged information in a table. Next, you'll configure pop-ups to present the information derived from the LoadHistory table.
Display and summarize load history
You'll configure pop-ups for the Low Voltage Service asset group and create three expressions to extract and display information collected in the LoadHistory table.
- In the Contents pane, expand Electric Device. Right-click the Low Voltage Service sublayer and choose Configure Pop-ups.
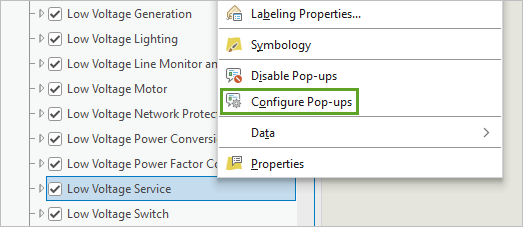
The Configure Pop-ups pane appears.
- In the Configure Pop-ups pane, click Expressions to create an Arcade expression.

- Click New.
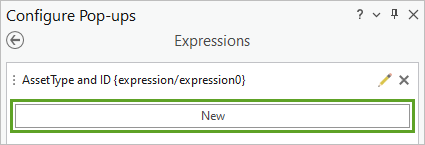
The Expression Builder window appears.
The first expression you'll create will be used to report the maximum Peak Load (kW) value for the selected service feature from the LoadHistory table.
- In the Expression Builder window, enter the following parameters:
- For Name, type Max.
- For Title, type MaxLoad.
The title is the display name of a virtual field used in the pop-up to display expression results.
- In the Expression text box, enter the following script:
//Create a variable to reference the LoadHistory table

var fshistory = FeatureSetByName ($datastore,"LoadHistory", ["peakload"])

//Create a variable to reference the GlobalID of the selected feature in the map

var GlobalID = $feature.globalID

// We are interested in rows from LoadHistory.serviceGUID that match the Service feature selected.  This filters results to return only ServiceGUIDs that match the $feature.GlobalID

var rows = filter(fshistory,"serviceGUID = @GlobalID")
//Guard logic to display 0 if no values found in the LoadHistory table
if (count(rows) == 0)return 0

//Return filtered values from LoadHistory.peakload in the Low Voltage Service pop-up in bold

return "<b>" +  max (rows, "peakload") + "</b>"
Note:
This expression uses the function max() to return the maximum value set for peak load. To return the minimum value set for peak load, you can replace max() with min().
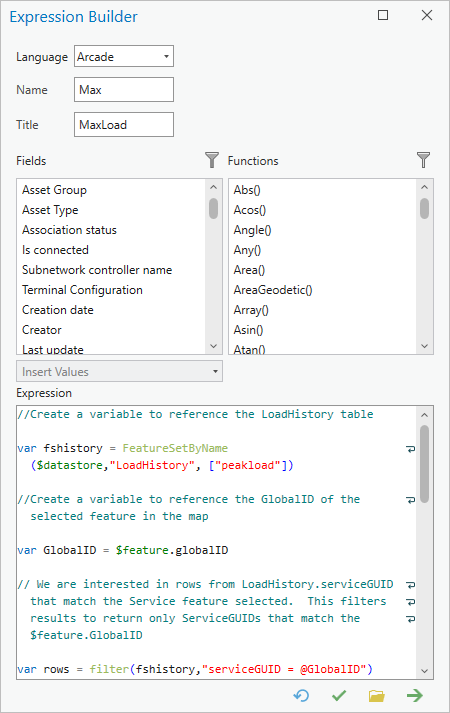
- Click the Verify button to validate the script. After the expression is validated, click OK.
Next, you'll create a second expression to report the minimum value set for Peak Load (kW) on the selected service feature from the LoadHistory table.
- In the Configure Pop-ups pane, click New. In the Expression Builder window, give the expression a name of Min and a title of MinLoad.
- In the Expression text box, enter the following script:
//Create a variable to reference the LoadHistory table var fshistory = FeatureSetByName ($datastore,"LoadHistory", ["peakload"]) //Create a variable to reference the GlobalID of the selected feature in the map var GlobalID = $feature.globalID // We are interested in rows from LoadHistory.serviceGUID that match the Service feature selected. This filters results to return only ServiceGUIDs that match the $feature.GlobalID var rows = filter(fshistory,"serviceGUID = @GlobalID") //Guard logic to display 0 if no values found in the LoadHistory table if (count(rows) == 0)return 0 //Return filtered values from LoadHistory.peakload in the Low Voltage Service pop-up in bold return "<b>" + min (rows, "peakload") + "</b>" - Verify the expression and click OK.
Next, you'll add an expression that communicates the number of times the selected service has been edited.
- In the Configure Pop-ups pane, click New. In the Expression Builder window, enter the following parameters:
- For Name, type Count.
- For Title, type #Updates.
- In the Expression text box, enter the following script:
//Create a variable to reference the LoadHistory table

var fshistory = FeatureSetByName ($datastore,"LoadHistory", ["peakload"])

//Create a variable to reference the GlobalID of the selected feature in the map

var GlobalID = $feature.globalID

// We are interested in rows from LoadHistory.serviceGUID that match the Service feature selected.  This filters results to return only ServiceGUIDs that match the $feature.GlobalID

var rows = filter(fshistory,"serviceGUID = @GlobalID")

//Guard logic to display 0 if no values found in the LoadHistory table
if (count(rows) == 0)return 0

//Return filtered values from LoadHistory.peakload in the Low Voltage Service pop-up

return "<b>" +  count (rows) + "</b>"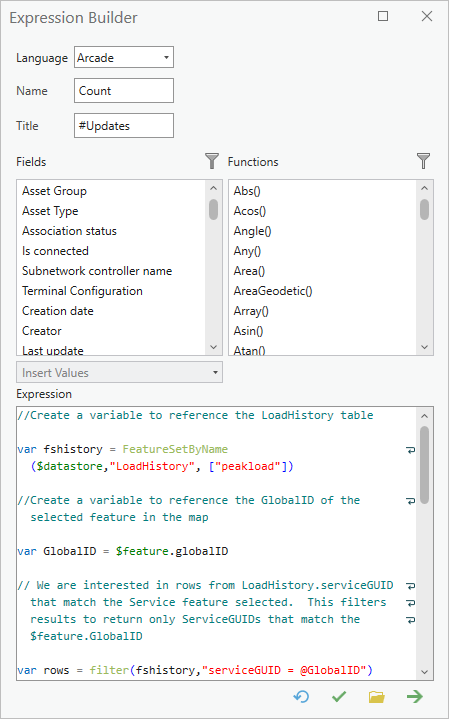
- Click the Verify button to validate the script. Click OK.
Lastly, you'll create an expression to calculate the average value of Peak Load (kW) for the selected service feature.
- Create a new expression with the name Avg and the title AvgLoad. In the Expression text box, enter the following script:
//Create a variable to reference the LoadHistory table var fshistory = FeatureSetByName ($datastore,"LoadHistory", ["peakload"]) //Create a variable to reference the GlobalID of the selected feature in the map var GlobalID = $feature.globalID // We are interested in rows from LoadHistory.serviceGUID that match the Service feature selected. This filters results to return only ServiceGUIDs that match the $feature.GlobalID var rows = filter(fshistory,"serviceGUID = @GlobalID") //Guard logic to display 0 if no values found in the LoadHistory table if (count(rows) == 0)return 0 //Return filtered values from LoadHistory.peakload in the Low Voltage Service pop-up in bold return "<b>" + average (rows, "peakload") + "</b>" - Verify the expression and click OK.
The Configure Pop-ups pane lists all of your expressions.
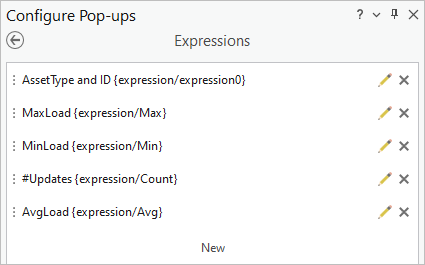
With your pop-up expressions configured, you'll confirm that expected results are being generated and displayed correctly in the pop-up window.
- On the Map tab, in the Navigate group, click the Explore tool. On the map, click the low-voltage service point you previously selected.
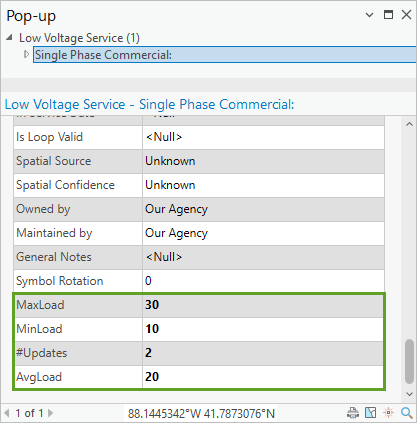
The pop-up for the selected low-voltage service appears.
- Scroll to the bottom of the pop-up.
The fields you added show their associated values derived from the LoadHistory table.
Note:
Building on the technique you used above, you can remove the bold format from the values returned in the pop-up, or make the values stand out even more by changing the display color to red if a value exceeds a certain number. To do this, use the if-else logic and the <font color> tag in your expressions.
- Close the pop-up and discard your edits. Save your project.
In this tutorial, you created a constraint attribute rule to maintain data integrity and display errors when spikes in peak load value were encountered. This provided an example of how a contain attribute rule can be used along with domains, subtypes, and contingent values to maintain data integrity in a geodatabase feature class.
You then created a table and configured a calculation attribute rule to detect a change in a service point's peak load and log this and the feature's GUID in the new table. With the attribute rules in place, you created a series of pop-up expressions using Arcade to derive information from the table containing peak load history and present this information using pop-ups in ArcGIS Pro.
This tutorial has provided you with the building blocks to begin creating more elaborate attribute rules in your geodatabase.
You can find more tutorials in the tutorial gallery.

