Explore an existing urban model
You will open an example urban model that has been created for Fullerton, California. The planning and design concepts used are fictitious and meant for training purposes only. No real-world planning or design is intended nor implied by this example model or content. You will use this model later to build your land use plans and scenarios.
- Go to ArcGIS Online to access the Fullerton urban model.
- Click the Fullerton urban model and click Open in ArcGIS Urban.
- On the ribbon, click Sign In and enter your account credentials.
Note:
If you don't have an organizational account, see options for software access.
Once you sign in, the urban model displays, showing many pushpins for various components of the model and the outline of the rail district area that you will use for your plans and scenarios.
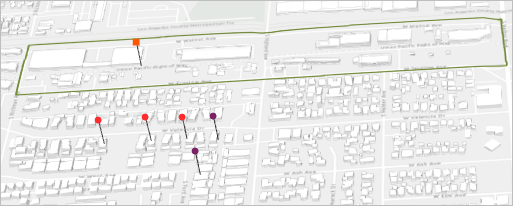
- Within the green plan outline, click the red pushpin to view its properties.
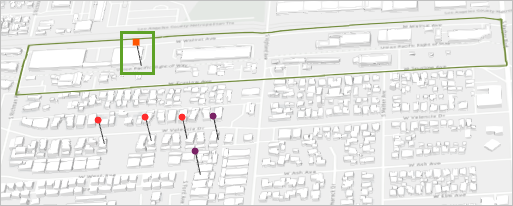
The side panel opens showing the properties of the plan that you clicked.
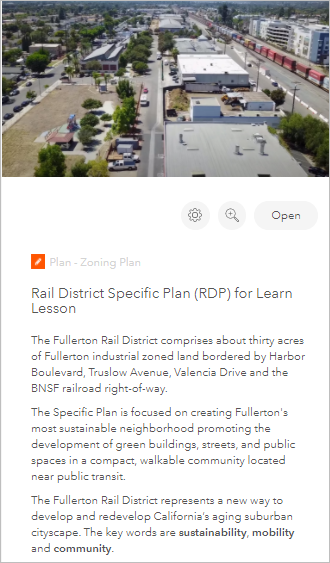
The urban model displays many locations in Fullerton that represent various land use plans that are accessible by the public. Your work will focus on the Rail District Specific Plan (RDP). In the main display, you see a public-facing view that contains a representation of your city along with three key elements: Projects, Plans, and Indicators. When you build your scenarios and plans, you will create these elements to help organize your work and build realistic scenarios. Below is some basic information about each element.
- Projects allow you to organize development proposals.
- Plans integrate land use and zoning data to enable scenario planning.
- Indicators are maps and charts that help describe the urban environment.
- On the side panel click Back to list.
Use navigation tools
Now that you have opened the urban model, you will work with primary user interface elements and navigation tools of Urban.
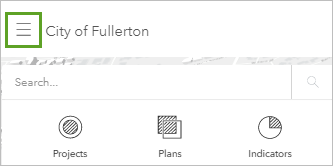
- On the ribbon, click the Options button to display the contents of the urban model.
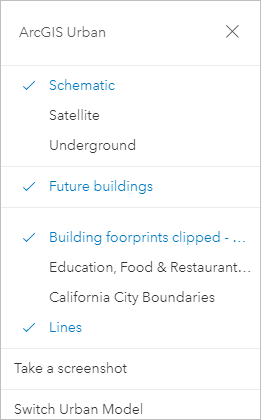
The layers in the urban model are divided into groups: base map styles and other context layers.
Note:
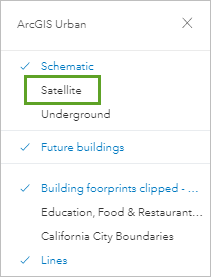
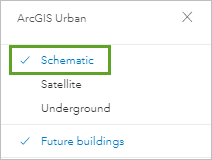
Currently, the Schematic representation is displayed. You can change to the Satellite or Underground representation to provide different views of the urban model.
Urban is open for public engagement and collaboration and contains many tools that facilitate this. You may want to access a model and take a screen shot to include in a presentation or report.
- In the contents side panel, click Take a screenshot.
- Draw a rectangle indicating the area you want to capture.
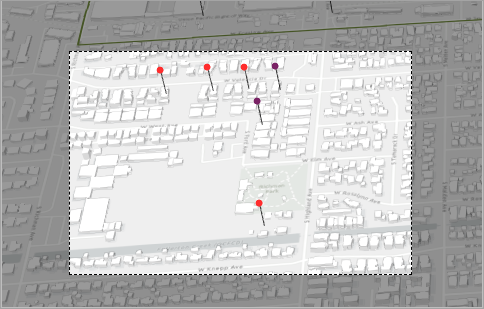
- On the ribbon, click Save.
The image downloads to your computer as a PNG file that you can include in other apps. You can access the screen shot from the download menu on the bottom or from the Downloads folder.
- On the ribbon, click Sign-In.

The sign-in information comes from your user profile. Urban detects which language is set up and supports all 39 languages. Your user profile is also where you set the display units for your models. For example, if you are working in the United States, you would use US Standard units, and if you were working in Europe, you would use Metric.
- Click Profile & Settings, and click View my settings.
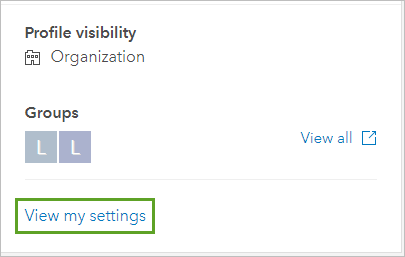
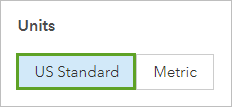
- Scroll to the Units section and either verify that US Standard is selected, or if it is not, click it.
- Return to the browser tab that contains your urban model.
- On the ribbon, click All accessible content.

The options here allow you to filter content that belongs to you, your organization, specific groups, or publicly available content. All accessible content, which is the default, encompasses all these options.
Navigate an urban model
A key aspect of working in urban models is navigating to view the model from different angles and to locate areas to build scenarios. You will often zoom in, pan, view in 3D, and tilt the view while you build your plans and scenarios. Now, you will explore some commonly used navigation controls.
- Left-click and drag the map to pan the view.
- Right-click while moving the pointer forward and backward to tilt the view.
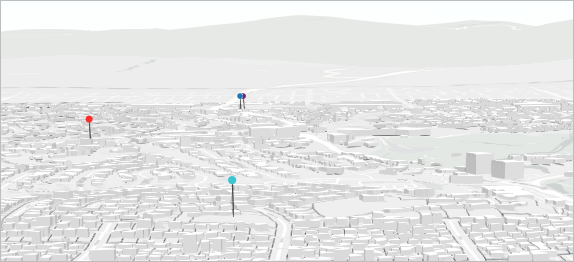
- Right-click while moving the pointer from side to side to rotate the scene.
- Double-click to zoom to the pointer.
- Use the mouse wheel to zoom in and out.
- Press N to rotate the view to face north.
- Press P to tilt the view to perpendicular.
- Press J to incrementally move closer in the view.
- Press U to incrementally move away from the view.
- Press the arrow keys to incrementally pan the view left, right, up, or down.
Being familiar with these navigation operations will help you explore models and develop scenarios.
Use the View toolbar
Urban has a toolbar at the bottom of the application window that is called the View toolbar. The View toolbar has additional tools for navigation and analysis, such as measurement, changing the time of day to view shadows, and performing a line of sight analysis. These operations are important when developing buildings and other elements when you want to see how those structures affect the surrounding areas.
- Locate the View toolbar near the bottom of the screen.
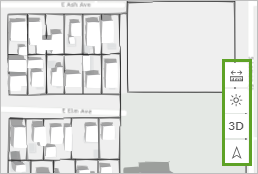
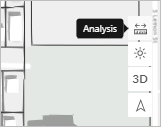
- Point to each tool to view its ToolTip.
- From the toolbar, click Tilt the view to change the view to 2D.
- Click Tilt the view to return to 3D.
- Right-click and move the view to the left or right.
- From the toolbar, click Set heading north to reset the view to the north.
- Click Daylight and move the slider to change the shadows based on the month and time of day.
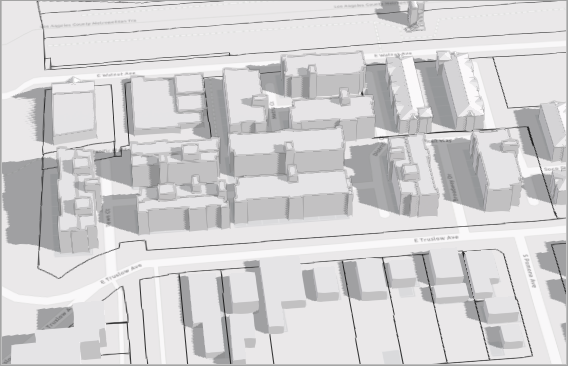
- Move the slider back to where no shadows display.
- Click Analysis to expand the toolbar.
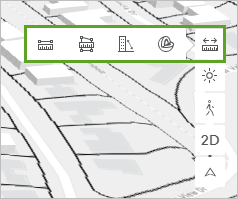
The options on this toolbar allow you to measure distance or area, perform line of sight analysis, and slice objects for cross-sectional analysis.
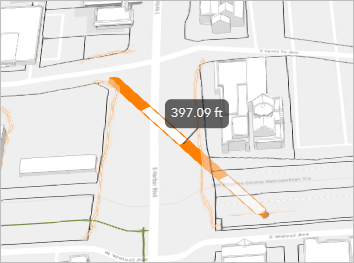
- Click Measure distance, click the view to begin a measurement, and double-click to finish it.
Note:
Once you complete a measurement, you can click New Measurement to start a new measurement, or click Close to exit.
- On the ribbon, click Close.
- On the View toolbar, click Analysis, and click Line of sight.
- Click to draw several sight lines from an observation point or your choice.
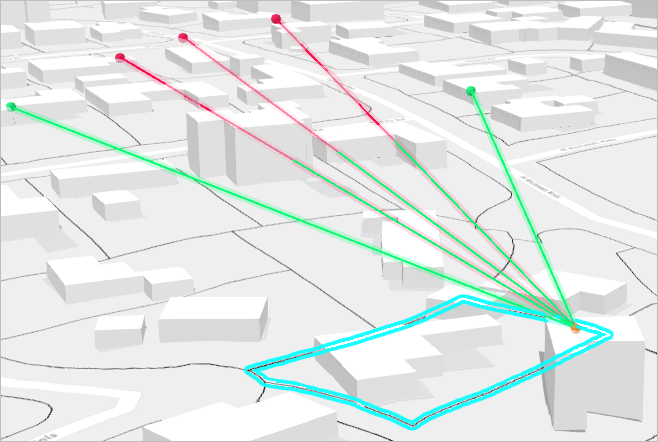
Performing an on-the-fly line of sight analysis is specifically useful for when you are developing buildings and want to visually analyze what you can see from the building or how that building affects the view from other locations. A green line indicates what is visible from the observer point and a red line indicates when a view is obstructed. An important consideration in development is how a building affects the views from other locations. Using the line of sight tool can provide a quick answer about how your buildings affect the surrounding areas.
- Click Close.
Below is a quick reference for some commonly used navigation operations:
- Left-click: pan.
- Right-click: rotate.
- Double-click: zoom in at pointer.
- Mouse scroll: zoom in or out.
- Press N: set the view to north orientation.
- Press P: set the view to perpendicular to the ground.
- Press J: move down, closer to the view.
- Press U: move up, away from the view.
- Arrow keys: move the view left, right, up, or down.
You have opened an urban model for the city of Fullerton and used it to explore navigation and analysis tools. You will use most of these tools as you develop your plans and scenarios and perform most of your work using urban models. Next, you will work with textured mesh basemaps to provide a more realistic view of your study area.
Explore Nearmap 3D textured mesh
Professionals in planning and economic development realize the value of a photorealistic 3D basemap for supporting key initiatives citywide. Using a 3D textured mesh from Nearmap, users can compare development proposals and review designs within an accurate context of their city. Next, you will search for and view Fullerton projects within the urban context provided by the 3D mesh.
- On the ribbon, click the Options button to open the contents side panel.
- Click Satellite, and close the side panel.
The 3D textured mesh appears, and the buildings look like realistic representations of actual buildings.
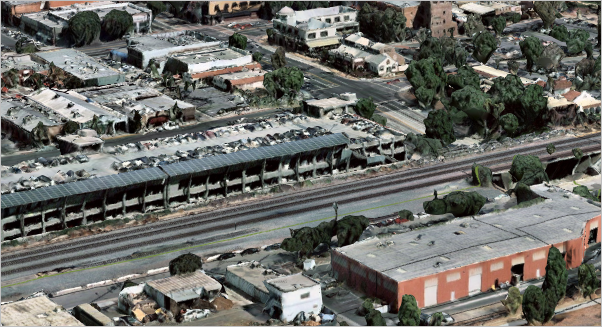
Adding the Nearmap 3D textured mesh to your urban model can enhance the aesthetics of the model and help users, especially non-GIS users, identify with a location.
- Click Projects.
- From the list, click Amplifi Apartments.

The urban model zooms to the Amplifi Apartments project.
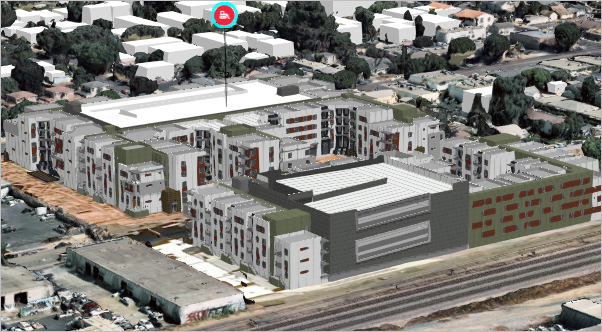
The development proposal for the Amplifi Apartments project is displayed in the existing 3D context.
In addition to the visualization, you can use the analysis tools, such as the interactive Line of Sight tool, simultaneously with the 3D mesh, to provide a more realistic view of what you can see from a location.
Earlier, you experimented with line of sight on a random location. Next, you will use the line of sight analysis to determine the impact and the views of the Amplifi development project.
- On the View toolbar, click Analysis, and click Line of sight.
- Click an upper-level window in Amplifi Apartments to place an observer point.
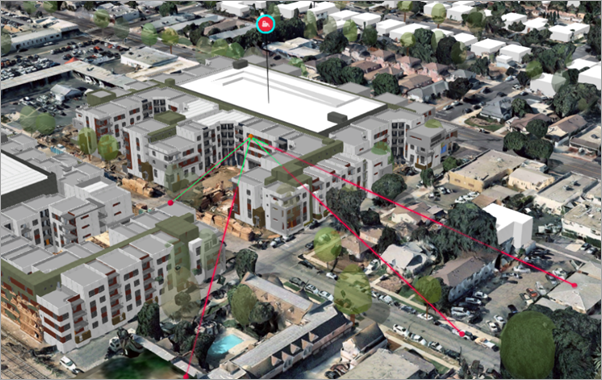
Green indicates what you can see from the observer point of view, and red shows where the target is not visible.
- Experiment by drawing more sight lines from different observer points, and click Close when you are finished.
- Change the basemap back to Schematic.
You accessed and explored an existing urban model, worked with many navigation tools, and used the line of sight tool to determine views from the proposed construction project. Now that you are familiar with the navigation and analysis tools, you will begin developing a land use plan.
Create a land use plan
The goal of the city’s Rail District Specific Plan is to convert existing industrial land to medium- and high-rise residential and commercial use. To ensure that the general plan land use is consistent with the requirements in the zoning code, you will update the land use for the rail district.
Only users with editing permissions can add zoning or lane use plans.
- If necessary, on the View toolbar, tile the view to the 2D top-down view, and click Set heading north.
- Zoom in to the existing plan boundary.

- On the ribbon, click Add, and choose Land Use Plan.
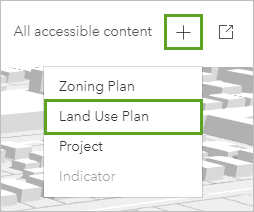
You will choose parcels to include in the new land use plan.
- On the ribbon, click Parcels.
The parcel boundaries appear in the scene.
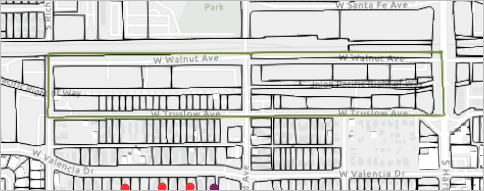
You will use the existing plan boundary to draw a land use plan of your own.
- Point to and click the northwest corner of the existing plan boundary to add a vertex.
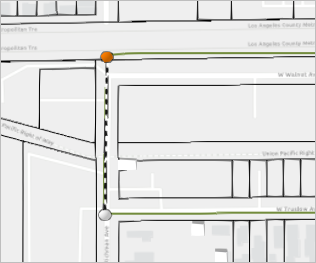
When you click in the scene to add a vertex, the drawing will begin at that location and then you can move your pointer along the plan boundary, clicking at each corner.
- As you move the pointer along the existing plan, click each corner to add vertices.
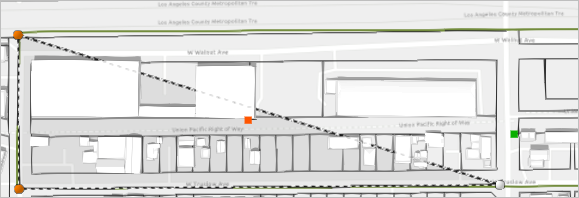
- Once you have added a vertex for the first three corners, double-click the final corner to finish the drawing.

- On the ribbon, click Add Plan.
- On the Plan Settings dialog box, add the following information:
- Name: Rail District.
- Address: The City of Fullerton, California, USA.
- Description: Rail District Land Use Update.
- Start Date: January 1, 2022.
- Uncheck End date same as start date.
- End Date: December 31, 2022.
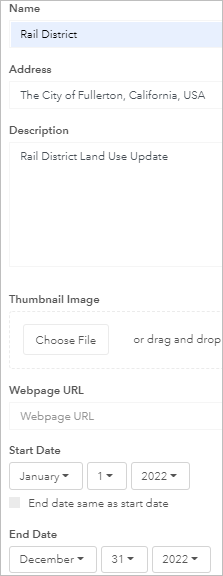
- Click Ok.
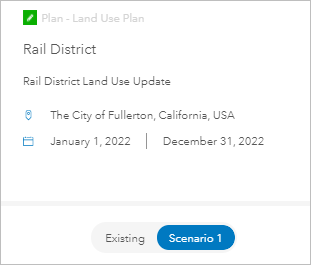
Your land use plan is added to the search panel and to the view. Now you can edit scenarios in the plan.
By default, each new plan includes the following scenarios:
- Existing Conditions—The current conditions of the people and places that cannot be modified.
- Scenario 1—The default scenario that you can edit.
Scenario 1 is highlighted; therefore, it is the active plan to be opened and edited.
- In the side panel, click Open to open Scenario 1.

The map updates to show the existing land use for downtown Fullerton, which consists of RAIL and IND land use types, in the plan area.

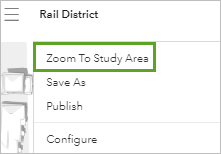
- On the ribbon, click Rail District, and choose Zoom To Study Area.
- On the ribbon, click the Land Use tab.

The existing land use allocation, which is primarily industrial (IND) and railroad (RAIL), is shown.
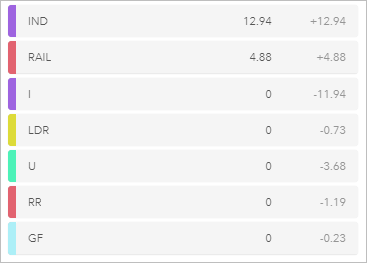
The existing land use allocation for the plan area indicates that most of the existing land use is industrial, and railroad makes up the remainder. To support the general plan update goal of converting existing industrial land use to medium- and high-rise mixed use, you will create a land use type and apply it to the industrial zone around the rail corridor.
Work with land use scenarios
To create land use concepts, you will learn to work with scenarios. Scenarios are different versions of a land use plan that contain design and planning concepts. Scenarios are also a design space where different approaches and ideas are organized for evaluation and communication, to capture feedback, explore additional options, and ultimately make decisions about urban growth strategies and policy.
You will create a scenario and will use it to propose land use changes.
- On the ribbon, click Configure scenarios.

- On the Scenarios dialog box, click Add Scenario.
- For Scenario Name, type Future Land Use.
- For Based on, choose Existing Conditions, or verify that it is already chosen.
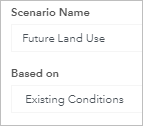
- Click Ok two times to add the scenario.

The scenario is added as an option in the Rail District project. You now have a scenario to begin exploring future land use concepts.
- On the ribbon, click Future Land Use to make it the active scenario.

The Future Land Use scenario is now active in the design mode. All changes that you make will occur only within the selected scenario, and not the existing conditions. The ability to have multiple scenarios makes it easier to keep your work organized. You could potentially have several scenarios, each depicting the future land use in different ways to allow planners to view the options and make informed decisions.
Create a space use type
In a land use element update, the land use type identifies population, dwelling units, and development potential at the comprehensive plan build-out. In Urban, space use types hold the coefficients to calculate population, households, and a variety of other metrics. To create a land use type that generates these metrics, you must first create a space use type with localized coefficients for population and households.
Next, you will create a space use type and capacity metrics for population and households, and use this space use type when you create a land use type.
- On the ribbon, click the Development tab.

- Click Space Use, and click Manage Space Use Types.
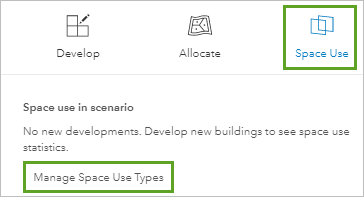
- Scroll down and find the RES_MF space use type.
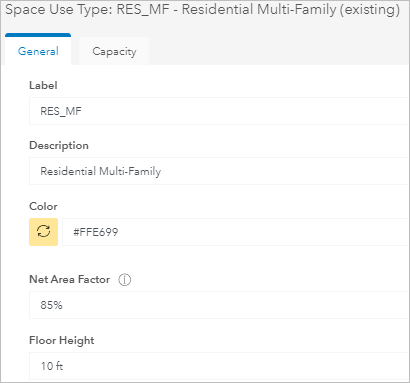
- Next to RES_MF, click Configure.

A dialog box displays the parameters of the selected space use type.
Note:
Net Area Factor is a factor applied to reduce the usable floor area for capacity calculations. Net floor area excludes square footage occupied by lobbies, stairs, elevators, mechanical and electrical services, and so on.
- Click Create duplicate.
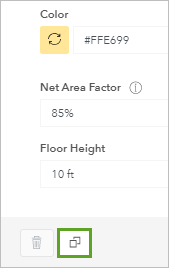
- For Label, type AFFHOUSE.
- For Description, type Affordable Housing.
- Keep the values for Net Area Factor and Floor Height.
- Click the Capacity tab.
- For Households, type 1200.
1,200 is the standard square footage for a residential affordable housing unit.
Note:
This information comes from the Building Square Footage Factors for Residential Units and Employment by Type table in the Sustainable Communities Strategy technical report (page 46).
- For Population, type 420.
This population value is based on 1,200 square feet per household, with an average of 2.85 people per household. 1,200/2.85 = 420 (approx).
- Scroll down and click Ok.
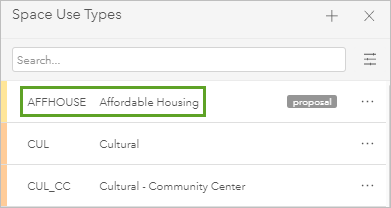
Your duplicated space use type is added to the table. Next, you will create a land use type using the duplicated space use type.
Propose a land use type
The space use type is created with localized coefficients for population and households. You will add it to a land use type and use it to calculate residential land use potential; that is, quantify the future build-out of the area based on this land use type.
- On the ribbon, click Land Use.
- In the scene, click any land use boundary to select it.
- Under Selected Land Use, click Modify, and click the add button.

- For Label, type RD-MXD.
- For Description, type Rail District Mixed-Use.
- For Max FAR, type 6.
Note:
FAR stands for Floor Area Ratio. The ratio is calculated by dividing the total floor area (of all floors) by the lot area. FAR limits the size of a build based on the lot size. For example, if your total floor area is 4,000 square feet and the lot area is 2,000 square feet, the FAR is 2. For more information about FAR, see What is FAR?.
- For Maximum Dwelling Units, type 100.
- Scroll down to Allowed Space Use Types.

In addition to the current space use types, you will add the space use type that you created earlier.
- For Select allowed space use, click the down arrow and individually choose the following space use types:
- Residential Multi-Family
- Office
- Cultural
- Retail
- Affordable Housing
- Parking
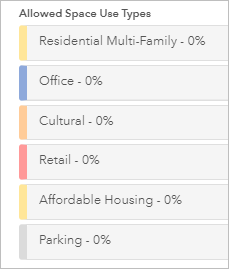
- Click each space use type to expand the header and assign a Target Distribution as follows:
- Residential Multi-Family: 20
- Office: 15
- Cultural: 10
- Retail: 10
- Affordable Housing: 30
- Parking: 10
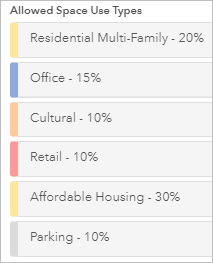
- Click Ok.
To see your duplicated land use type, you will apply a filter.
- Under the Select land use type list, click Filter.

- Click Proposed in this plan.
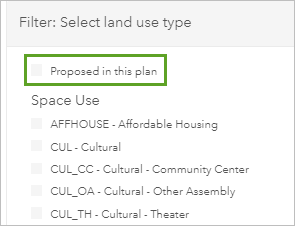
- At the bottom of the panel, click Apply Filters to see your land use type.
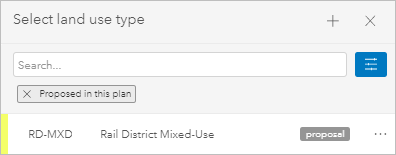
You have created a land use type for the rail district to support mixed-use development. Now, you are ready to begin authoring your land use plan.
Author a land use plan
Next, you will apply your land use type in the rail district plan. Applying the land use type to an existing land use boundary links the land use type parameters to all the parcels that fall within the boundary.
The city's Rail District Specific Plan will convert existing industrial land use to medium- and high-rise mixed-use. To ensure that the general plan land use is consistent with the zoning code, you will update the land use for the rail district.
- On the ribbon, verify that Future Land Use is the active plan.

- On the ribbon, click Land Use.

- Zoom to the following set of parcels around the railway, on the eastern side of the plan boundary:

The current land use for the specific plan area is largely industrial, indicated by the purple color and the I label.
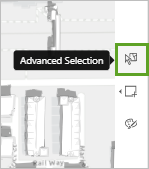
- On the View toolbar, click Advanced Selection.
- From the blue banner containing the tools, click Rectangle select.
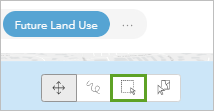
- Drag a box around the following polygons on the eastern side of the plan:
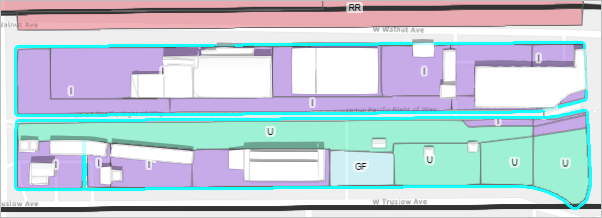
- On the blue Advanced selection toolbar, click Done.
You have selected a group of parcels and will modify them to the RD-MXD type that you created earlier.
- In the side panel, under Selected Land Use, click Modify.
- Click RD-MXD to apply it to the select parcels.

Note:
The color assigned to your RD-MXD features may differ, as they are randomly assigned.
The rail district mixed-use land use zone has dwelling units defined, assigned space uses, FAR defined, and will generate localized capacity metrics when used in development scenarios. You will examine the various metrics in the next section.
Evaluate land use change through land use potential
In Urban, land use potential is calculated if the residential land use types have Maximum Dwelling Units per acre defined and assigned space uses. For nonresidential-related land use types, you must include a value for Maximum FAR and assign space uses.
The proposed RD-MXD land use type has a FAR of 6, and assigned space uses to calculate numbers generated for population, jobs, and households based on the land use development.
- In the side panel, click Capacity.

- Use the Advance Selection tool to select the parcels that you just modified to RD-MXD, and click Done.
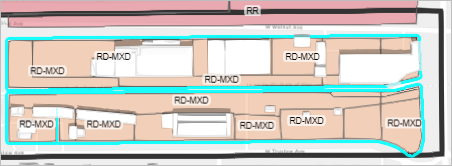
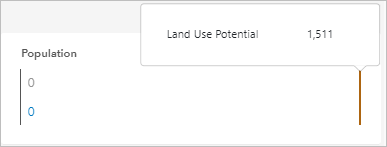
- In the Population section, point to the red line to view the Land Use Potential.
Note:
Your values may vary from what is shown.
Land use potential tells you the population accommodated if this area were fully developed based on the land use change.
- Point to the red line for Households and Jobs to examine the Land Use Potential numbers.
The values indicate that this area has the potential to support the number of Households and Jobs indicated.
Note:
The land use type includes space use types that support jobs (office space use) and people (residential multi- and single-family space uses). The coefficients related to these space use types drive the capacity metric calculations.
- Click Close.
- In the Plan Details card, click Back to List.
Next, you will work with one of the plans in the plans list.
Now that you have designated a land use type, you will use it to validate proposed zoning for the city’s Rail District Specific Plan.
Work with zoning plans
Zoning can change the world. When used constructively, zoning promotes inclusivity, reflects a community’s vision, and improves quality of life. In Urban, zoning changes are seamless. You can propose zoning changes, test redevelopment patterns, and reimagine entire neighborhoods. You will make a copy of the Rail District Specific Plan so that you can create your own zoning types and plans within it.
- In the side panel, click Rail District Specific Plan (RDP) for Learn Lesson.

- In the side panel, click Open.
The plan displays in the scene.

The plan appears in the scene. So that you do not edit the existing plan, you will save a copy of it to your organization and edit the copy.
- On the ribbon, click the plan name, Rail District Specific Plan (RDP) for Learn Lesson, and choose Save As.
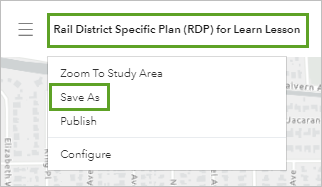
- Name the plan Rail District Specific Plan (RDP) Fullerton copy, and click Ok.
- On the ribbon, click Configure scenarios.

- On the dialog box, click Add Scenario.
- For Scenario Name, type High Density Mixed Use, and add your initials at the end.
- For Based on, click the down arrow and choose Existing Zoning, and click Ok twice to add your scenario.
You have created a scenario to explore zoning concepts and build different designs. Next, you will apply a zoning type to the plan area.
Create and apply a zoning type
Now that the rail district's land use is updated, the foundation to shape the way new development in the area will occur is in place. The next step is to create a zone type. The zone type contains specific, detailed uses permitted in the zone area and acts as a regulatory mechanism to implement changes proposed in a comprehensive plan update.
- On the ribbon, click the High-Density Mixed Use scenario to activate it.

- If necessary, tilt the view from 3D to 2D and set the heading north.
- On the ribbon, click Zoning.

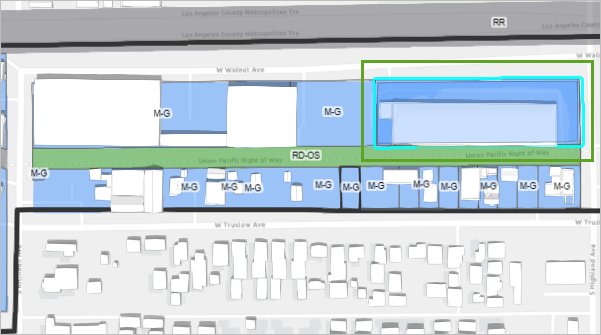
- Zoom in and select the parcel that is shown in the example.
- In the side panel, for Selected Zoning, click Modify.

Here, you can see a list of every zone in the city, including existing and proposed zones.
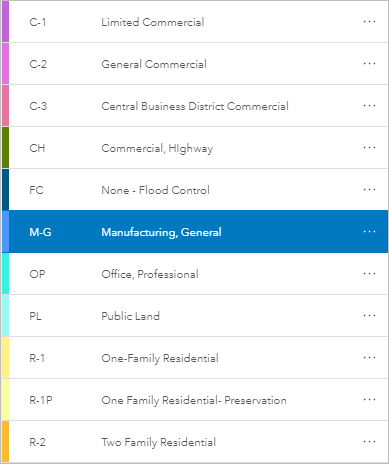
- Scroll down to the highlighted M-G zone and click Configure.

The details about the zone, such as Maximum Coverage, Maximum Height, and Maximum FAR, are shown. Other parameters include setbacks and allowed space use types. Because this is an existing zone, you cannot edit it. To explore potential changes to the blocks’ zoning parameters around the rail district, you will create a zoning type.
- Click Cancel.
You will explore potential changes to the zoning parameters by creating a zone that supports typical mixed-use development. The zone will include Residential Multi-Family, Office, Cultural, Retail, Hotel, Affordable Housing, and Parking space use types.
- In the side panel, next to Select zoning type, click Add.
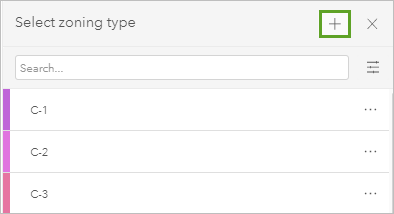
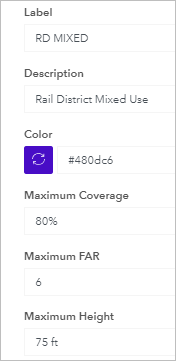
- On the New Zoning Type dialog box, type the following parameters:
- Label: RD MIXED and your initials
- Description: Rail District Mixed Use
- Color: copy and paste or type #480dc6
- Maximum Coverage: 80
- Maximum FAR: 6
- Maximum Height: 75
- For Tiers & Setbacks, click Tier 1 to expand it.
- Add the following values for the setbacks:
- Start height: leave as is
- Front interior setback: 30
- Front street setback: 20
- Side interior setback: 10
- Side street setback: 10
- Rear interior setback: 20
- Rear street setback: 20
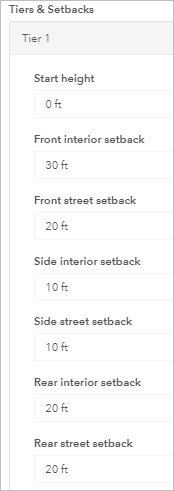
Zoning setbacks are common and apply to lots or parcels' property lines—referred to as parcel edges in Urban. Urban supports three types of setbacks—front, side, and rear. You can specify whether the edges are adjacent to a street or an interior lot line within each of these major types.
- Under Allowed Space Use Types, click Select allowed space use, and add the following types:
- Residential Multi-Family
- Office
- Cultural
- Retail
- Hotel
- Affordable Housing
- Parking
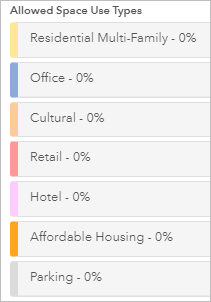
- Verify that you have added all seven space use types, and click Ok to create the zoning type.
Your proposed RD MIXED zoning type is added to the list. Next, you will apply the zoning type to the zones in the plan area. Applying a zoning type to a zoning boundary links its parameters to all the parcels that fall within the boundary.
- On the vertical toolbar next to the map, click Advanced Selection.
- On the Advanced selection toolbar, choose Rectangle select.
- Draw a rectangle around the highlighted parcels in the image below to select them.

- On the Advanced selection toolbar, click Done.
- In the side panel, for Selected Zoning, click Modify.
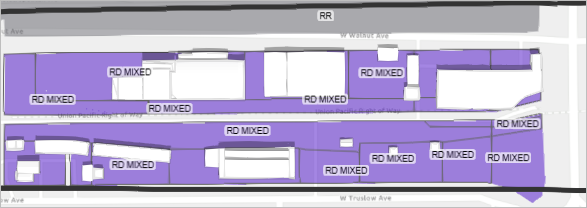
- In the list, locate and click your RD MIXED zoning type to assign it to the selected parcels. Click anywhere off of a selected parcel to clear the selection
Note:
Your zoning labels will display your initials that you provided when you created the zoning type.
The RD MIXED zoning type is applied to the selection. The color and label of the zones also change to match the zoning type.
Zoning validation by land use plan
Unlike land use plans, zoning plans are where planners can propose zones, create buildings and space use types, and apply them to parcels. Land use plans work solely with land use data to guide the future development of a city. In this fictitious scenario, the City of Fullerton hopes to build more housing by redeveloping its Rail District Specific Plan.
California state law requires that zoning conforms with the underlying land use defined in a comprehensive plan. This is because the city's planning goals represented by the land use element can't be attained without zoning codes' regulatory mechanisms. Therefore, the City of Fullerton requires that there is consistency between zoning and land use.
In the previous step, you changed the industrial land use to rail district land use, designed to support medium- to high-rise mixed use. Next, you will set up zoning validation by land use. Whenever a zoning type is not suitable for designated land use, you will see a warning label. This allows you to validate proposed zoning changes for this scenario against proposed land use types.
- On the ribbon, next to Rail District Specific Plan (RDP) Fullerton copy, click menu.

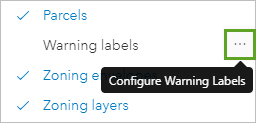
- Next to Warning labels, click Configure Warning Labels.
- For Land Use, click Land Use Plan.

- For Plan, verify that Rail District is selected.
- For Scenario, click the down arrow, and choose Future Land Use.
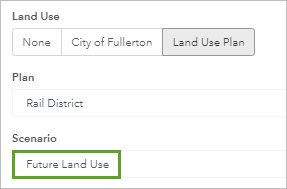
The is the scenario where you proposed a new Rail District land use.
- Click Ok.
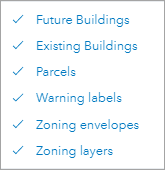
- In the layer list, click Warning labels to display them in the scene.
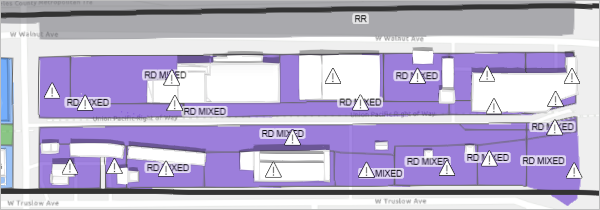
Warning labels appear in the scene.
- On the ribbon, next to the plan name, click the Menu button to close the layer list.
- In the scene, select any RD-MIXED parcel with a warning label on it.
In the side panel, an explanation is given for the warning label.
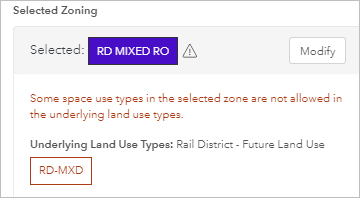
The warning states that the rail district underlying land use type does not support one or more of the proposed zone space uses. You can see which space use is not supported and then remove it.
- For Underlying Land Use Types, point to RD-MXD to see allowed space use types.
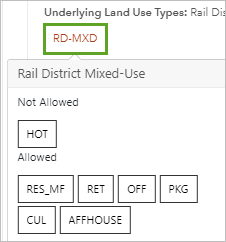
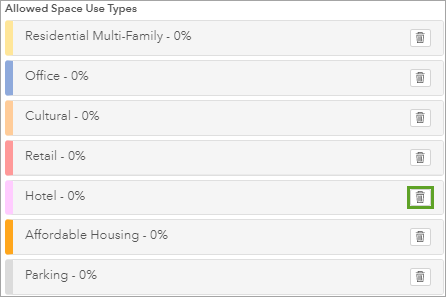
The Hotel space use type is causing the error because it is not an allowed type for the Rail District plan. To resolve the warning labels, you will remove the Hotel space use type.
- In the scene, use Advanced Selection and Rectangle select to select all RD-MIXED parcels in the plan boundary, and click Done.
- In the Zoning Type panel, under Selected Zoning, click the RD MIXED label to open the configuration window.

- Scroll to Allowed Space Use Types and delete Hotel.
- Click OK.
You will refresh the plan to see the difference after removing the Hotel space use type.
- On the ribbon, click Close. In the side panel, click Open to open your Rail District Specific Plan (RDP) Fullerton copy, and activate your High Density Mixed Use scenario.
- On the ribbon, click the menu button and turn on Warning Labels.
The warning labels are removed now that the space use types in the zone type correspond to the underlying land use.
Now that you have the proper zoning established for the parcels, you will develop the Rail District area by assigning a mix of building types.
Allocate building types
Now that you have designated a new zoning type, you will explore the impacts of this zoning change when you apply building types. You will incorporate an integrated mesh layer and the satellite basemap to enhance the display.
- On the ribbon, click Menu, and choose Satellite.
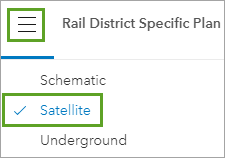
- Click the Menu button to close the table of contents.
- On the ribbon, click Development, and click Allocate
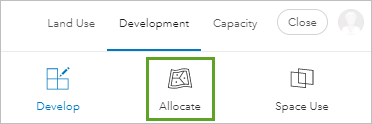
Here, you can assign many building types at a time based on an allocation percentage. You will select some parcels in the plan area and evenly allocate their building types for this example.
- Select the parcels highlighted in the image below by holding the Shift key and clicking each parcel.

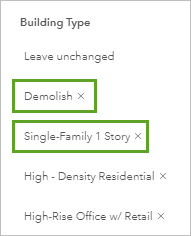
In the side panel, there are several options for building types for the selected parcels: Leave unchanged, Demolish, and Single-Family 1 Story.
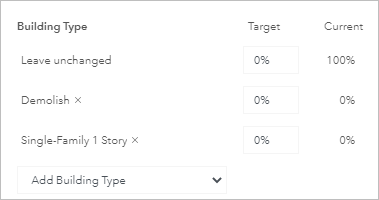
You will add some high-density building types to align with the zoning type for the rail district area and remove the other types.
- Click Add Building Type.
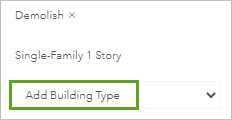
When you click Add Building Type, you have access to many building types that you can assign to your parcels. You will add a few high-density building types.
- In the Add Building Type menu, individually add the following building types (after you add a type, you must click Add Building Type again):
- High-Density Residential
- High-Density Residential w/ Retail
- High-Density Res/Aff Housing
- High-Density Res/Ret/Aff Housing
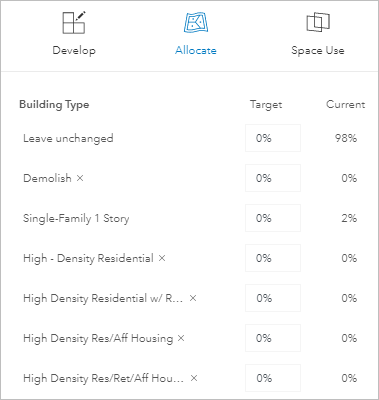
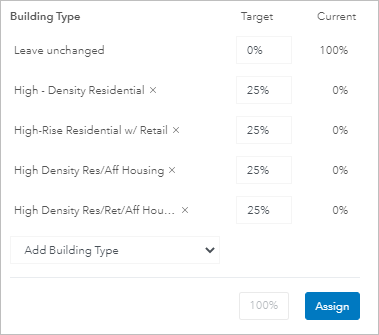
The building types appear in the list. Next, you will remove the unwanted types and redistribute the building type percentages for all the high-density types to add up to 100 percent.
- Under Building Type, delete Demolish and Single-Family 1 Story.
- For each of the high-density types that you added, in the Target column, type 25.
Now that you have allocated percentages to only the high-density building types, you will assign them.
- Click Assign, and in the model, click anywhere off of a feature to clear the selection.
Now you can see building types on the selected parcels. When you develop parcels, the existing 3D buildings are masked—essentially demolishing them and replacing them with the proposed buildings.
- On the View toolbar, switch the scene to 3D and tilt it to see the differences in buildings.
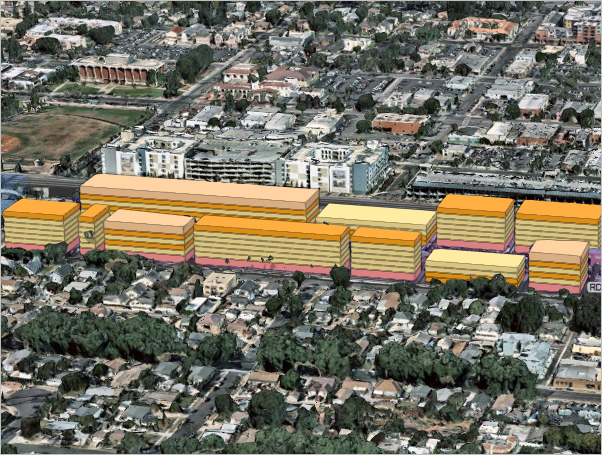
Viewing the scenario in 3D gives a good perspective of how this potential redevelopment scenario for the rail district fits into the city of Fullerton.
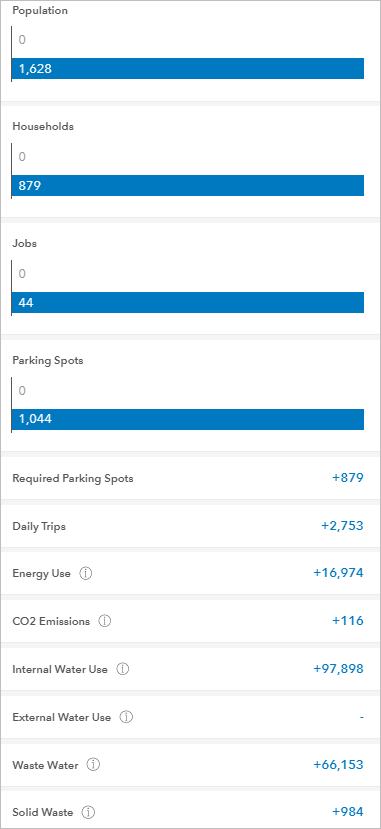
- On the ribbon, click Capacity.
Note:
Your results may not exactly match the example, but the steps and process for conducting the analysis is not affected.
Based on the buildings you generated, you can see some general capacity impacts due to the land use change.
The capacity dashboard allows key stakeholders to broadly understand the general capacity potential due to this land use change. Cities can create more project-specific, realistic building designs, and more realistic capacity indicators in the zoning plan.
You have used Urban to access an example model for the city of Fullerton, California, and used it to explore the redevelopment of the rail district area in town. You worked with space use types, zoning, and land use to create a potential redevelopment scenario based on proposed changes to the area. Your scenario modeled proposed land use changes for the rail district, from primarily industrial land use to a combination of residential and retail. Using your plan and scenarios, city planners can explore the impacts of the redevelopment on the surrounding areas and determine whether the proposed scenario is best for the city.

