Prepare data for analysis
Obstacle analysis is critical for ensuring safe and efficient operation of aircraft. It involves a spatial analysis of all obstacles around an airfield against a surface that represents minimum operating levels for aircraft approaching and departing the airport. ArcGIS Aviation Airports has several geoprocessing tools that allow you to import, analyze, and visualize obstacles that may present a safety hazard to aircraft.
Download the data
To start, you'll download and open a project with aviation features in ArcGIS Pro.
- Download the ObstacleAnalysis project package (.ppkx file).
- Double-click the ObstacleAnalysis project package to open it in ArcGIS Pro.
If prompted, sign in to your ArcGIS account or ArcGIS Enterprise account.
Note:
If you don't have access to ArcGIS Pro or an ArcGIS organizational account, see options for software access.
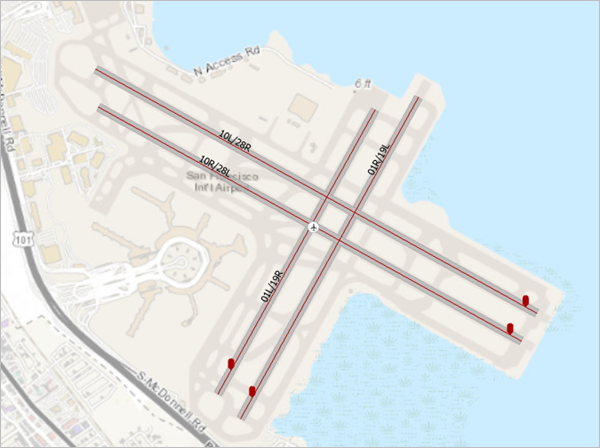
The project opens and a map containing aviation features appears.
You'll save this project to a local file on your hard drive.
- On the ribbon, click the Project tab.
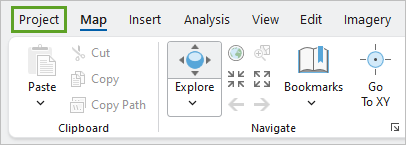
- Click Save Project As.
- In the Save Project As window, browse to your ArcGIS folder. Open the Projects folder.
Note:
The Projects folder may be browsed to by default.
- For Name, type Obstacle_Analysis. Click Save.
Before continuing, you'll ensure that ArcGIS Pro is configured with the ArcGIS Aviation Airports extension.
- On the ribbon, click the Project tab. Click Licensing.
- In the ArcGIS Pro Extensions table, confirm that Aviation Airports has a Licensed status of Yes.
If the extension is licensed, proceed with the tutorial. If it is not, you can request a trial license.
- Click the Back button to return to the project.
The project contains layers of points, lines, and polygons that represent features at San Francisco International Airport (SFO). In the Contents pane, you'll find the following features:
- VerticalStructurePoint—A point feature class that will hold obstacle features.
- AirportControlPoint—A point feature class containing airport elevation and runway displaced threshold features.
- ObstructionIdSurface_MP—A multipatch feature class that will hold obstruction identification surfaces.
- RunwayCenterline—A polyline feature class containing runway center line features at SFO.
- Runway—A polygon feature class representing runways at SFO.
The ObstructionIdSurface_MP feature class is empty, but the layer has been symbolized by surface type. An obstruction identification surface is made of several component surfaces. The following diagram shows the types of surfaces contained in a typical obstruction identification surface. You'll create an approach surface later.

An OIS includes the following components:
1
Conical surface
2
Horizontal surface
3
Approach surface
4
Transitional surface
Acquire obstacle data
Now that you're familiar with the feature classes in the project, you'll populate the VerticalStructurePoint feature class with obstacle data from the Federal Aviation Administration (FAA). The FAA distributes a Digital Obstacle File (DOF) that contains obstacle data for all 50 states as well as United States-controlled airspace.
The FAA's DOF is released on a regular basis under a public domain license. You can download the most recent DOF from the FAA's website, but for this tutorial you'll use a sample DOF from November 2020.
- Download the SourceData package.
- Extract the compressed folder to a location on your computer you can easily remember, such as your Documents folder.
- In ArcGIS Pro, on the ribbon, click the View tab. In the Windows group, click Catalog Pane.

- In the Catalog pane, right-click Folders and choose Add Folder Connection.
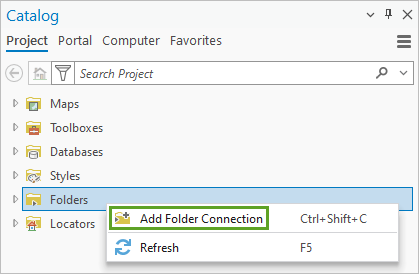
- Browse to the SourceData folder you extracted and click OK.
- Expand Folders and expand the SourceData folder.
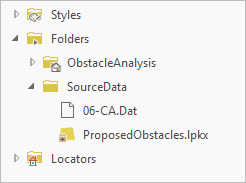
The SourceData folder contains two files. The 06-CA.Dat file is a DOF containing obstacles in the state of California. The ProposedObstacles.lpkx file is a layer package containing additional obstacles that are not in the DOF.
- On the ribbon, on the View tab, in the Windows group, click Geoprocessing.

- In the Geoprocessing pane, search for Import Digital Obstacle File. In the list of search results, click Import Digital Obstacle File.
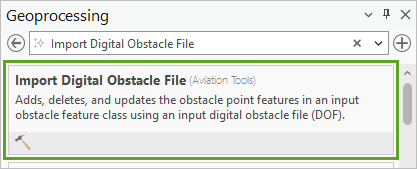
The Import Digital Obstacle File tool opens.
Note:
If you receive a Tool is not licensed message, you do not have a license for ArcGIS Aviation Airports. You can request a trial license. You won't be able to proceed with this tutorial until you have a license.
- For Input Digital Obstacle File, click the Browse button.
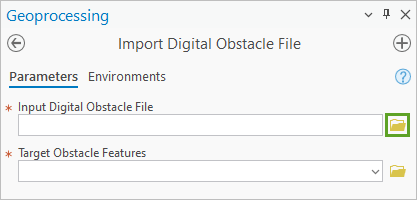
- Browse to the SourceData folder and double-click the 06-CA.Dat file.
- For Target Obstacle Features, choose VerticalStructurePoint.

- Click Run.
The tool runs and obstacle points are added to the map.

You've loaded obstacle data points from the DOF into the VerticalStructurePoint feature class. Each of these points represents a human-made obstacle. You can click these data points to view their attributes.
The VerticalStructurePoint feature class includes attributes that describe the type of obstacle, the height of the obstacle above mean sea level, the obstacle's height above the surface, and more. The FAA's DOF is updated every 56 days. The DOF you imported does not contain obstacle data for cranes that will be brought in to do planned construction on the rental car facility, so you'll add those next.
Add a layer package containing obstacles
The data you downloaded in the SourceData package includes a layer for possible crane locations for the planned construction. Next, you'll add that data to the map.
- At the bottom of the Geoprocessing pane, click the Catalog tab.

- In the Catalog pane, right-click ProposedObstacles.lpkx and choose Add To Current Map.

The ProposedObstacles.lpkx file is a layer package that contains additional obstacles that are not in the DOF.
- In the Contents pane, right-click the ProposedObstacles layer and choose Zoom To Layer.
The ProposedObstacles layer contains eight point features (symbolized with open blue circles) representing possible locations of a construction crane.

- Click one of the features to view its attributes.
A pop-up appears. It displays many attributes, including Elev_Val, which contains the elevation above mean sea level at the top of the crane. You'll use the Elev_Val field to visualize these obstacles in 3D later in this tutorial.
- Close the pop-up.
- On the Quick Access Toolbar, click the Save Project button.

You've prepared the project for analysis by loading the DOF data and adding the proposed crane locations to the map. The next step is to begin analyzing the data.
Analyze airport obstacles
Next, you'll create surfaces for the airport that you'll use to identify if any of the obstacles that you've added to the project will pose a hazard to aircraft.
Create obstruction identification surfaces
Obstruction identification surfaces (OIS) are multipatch or polygon features that represent the clearance between an aircraft in the air and obstacles on the earth's surface. The following image shows an approach OIS surface in 3D for a runway at a municipal airport:

This image indicates that the height of the OIS (1) changes as the surface slopes down toward the runway (2). For this workflow, you are interested in obstacles whose heights intersect the OIS at any point on its slope down to the runway. Those penetrating obstacles may present a hazard to flight operations.
ArcGIS Aviation Airports contains several geoprocessing tools to generate an OIS for different specifications. Aviation authorities, such as the FAA and ICAO, provide standards and specifications for OIS creation. You'll create an OIS using the FAA FAR 77 geoprocessing tool.
- On the map, zoom out until you can see the airport runways with their labels.
- On the ribbon, click the Map tab. In the Selection group, click the Select button.

- Click the runway 10R/28L centerline to select it.

- In the Geoprocessing pane, click the Back button. Search for and open the FAA FAR 77 tool.

- In the FAA FAR 77 tool, enter the following parameters:
- For Input Runway Features, choose RunwayCenterline.
- For Target OIS Features, choose ObstructionIdSurface_MP.
- For High Runway End Classification, choose Non precision instrument runway greater than (>) 3/4 mile visibility.
- For Low Runway End Classification, accept the default value of Same as high runway end classification.
- For Input Airport Control Point Feature, choose AirportControlPoint.

- Click Run.
The tool runs. The OIS features for the selected runway, 10R/28L, are added to the ObstructionIdSurface_MP feature class.
- Zoom out to view the full extent of the updated ObstructionIdSurface_MP layer.

- On the ribbon, on the Map tab, in the Selection group, click Clear.
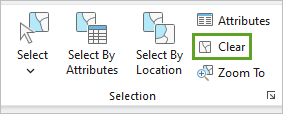
The selection is cleared. You can also run the tool on all of the runways for an airport, but for simplicity in this exercise, you'll only do it for this selected runway.
The OIS you generated includes approach, conical, horizontal, primary, and transitional surfaces. Since you are interested in obstacles at the end of runway 10R, you'll only analyze the approach surfaces.
Set a definition query for approach surfaces
You'll use a definition query to filter which surfaces are visible based on their attribution.
- In the Contents pane, right-click the ObstructionIdSurface_MP layer and choose Properties.
- In the Layer Properties pane, click Definition Query.
- Click New definition query.
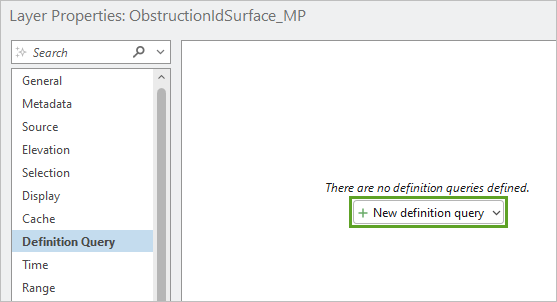
- Create the query Where Name is equal to Approach Surface.

- Click Apply.
- Click OK.
The definition query is applied. Only the approach surfaces are shown on the map.

Analyze runway obstacles
On the map, several obstacles overlap with the approach surfaces at either end of this runway. These existing obstacles are symbolized with blue dots, and the proposed obstacles associated with the construction are symbolized with large blue circles. There appear to be significantly more obstacles at the low-end of this runway when compared to the high-end, as shown in the following image:

While you can assume each of these obstacles may interfere with an aircraft's ability to take off or land at this runway, only obstacles that penetrate the OIS are considered a flight hazard.
The Analyze Runway Obstacles geoprocessing tool compares the elevation values of the obstacles with the height of the approach surface as it slopes down to a runway. This tool outputs a new feature class that describes how each input obstacle interacts with the OIS approach surface.
You'll use the Analyze Runway Obstacles geoprocessing tool to determine which features intersect the OIS approach surface and should be classified as flight hazards.
- In the Geoprocessing pane, click the Back button. Search for and open the Analyze Runway Obstacles tool.
- In the Analyze Runway Obstacles tool pane, enter the following parameters:
- For Input OIS Features, choose ObstructionIdSurface_MP.
- For Input Obstacle Features, choose VerticalStructurePoint.
- For Output Obstacle Feature Class, type DOF_Hazards.
- For Obstacle Height, choose Elev_Val.
- For Unit, choose Feet.

- Click Run.
The tool runs and the DOF_Hazards layer is added to the Contents pane. The DOF_Hazards layer contains several features, indicating multiple points that are within the OIS.
- In the Contents pane, right-click the DOF_Hazards layer and choose Attribute Table to see the attributes.
The following diagram shows an obstacle penetrating an OIS and the corresponding field values:

1
Obstruction Identification Surface (OIS)
2
The obstacle.
3
The Delta_Z field value.
4
The OIS_Z field value.
5
The Z field value.
The Delta_Z field refers to the height of the obstacle above or below the OIS. Features with a negative Delta_Z value are below the OIS, while features with a positive or zero Delta_Z value are penetrating the OIS.
- Close the table.
Use a definition query to show penetrating obstacles
Next, you'll set a definition query on the DOF_Hazards feature layer to determine the exact number of obstacles that penetrate the OIS.
- In the Contents pane, right-click the DOF_Hazards layer and choose Properties.
- In the Layer Properties window, on the Definition Query tab, click New definition query.
- Create the query Where Delta_Z is greater than or equal to 0.

- Click Apply.
- Click OK.
The definition query is applied.
- On the Contents pane, right-click DOF_Hazards and choose Zoom To Layer.
Six penetrating DOF obstacles are shown on the map.
Note:
The symbology of the layer is randomly generated and may differ from the example image, but it does not impact the results of the analysis.

Analyze proposed obstacles
Next, you'll run the Analyze Runway Obstacles geoprocessing tool again to analyze obstacles from the ProposedObstacles feature layer.
- In the Geoprocessing pane, in the Analyze Runway Obstacles tool, change the following parameters:
- For Input Obstacle Features, choose ProposedObstacles.
- For Output Obstacle Feature Class, type Construction_Hazards.

- Click Run.
The tool runs and the Construction_Hazards feature layer is added to the Contents pane.
- If necessary, zoom out until you can see the construction hazards.
The Construction_Hazards feature layer contains eight features.

You'll use a definition query similar to the one you used for DOF obstacles to show obstacles that penetrate the OIS.
- In the Contents pane, right-click Construction_Hazards and choose Properties.
- On the Definition Query tab, click New definition query.
- Create the query Where Delta_Z is greater than or equal to 0.
- Click Apply.
- Click OK.
The definition query is applied. Two Construction_Hazard features are shown on the map.

This indicates that two of the proposed cranes for the construction on the rental car facility, shown with yellow circles, may pose a risk to flight operations.
- Save the project.
You've created the OIS surfaces and compared the DOF hazards and the proposed construction crane sites to them. You determined that two of the proposed construction crane sites may pose a hazard.
Visualize the airport and obstacles in 3D
You can visualize your OIS and obstacle data in 3D with ArcGIS Pro. Viewing your data in 3D allows you to gain additional insights about flight hazards along an approach surface.
Display DOF hazards in 3D
You'll convert the map to a 3D scene. Then, you'll display your obstacle data in three dimensions by extruding the obstacle features to their true height above the surface.
- On the ribbon, click the View tab.
In the View group, click Convert and choose To Local Scene.

A Map_3D view appears with a 3D scene containing the same layers as your map. This is a local scene, which is better for showing local scale data than a global scene. Local scenes support local coordinate systems, such as the State Plane coordinate system used in this map.
- In the Contents pane, right-click DOF_Hazards and choose Properties.
- In the Layer Properties window, click the Elevation tab.
- For Features are, choose On the ground.
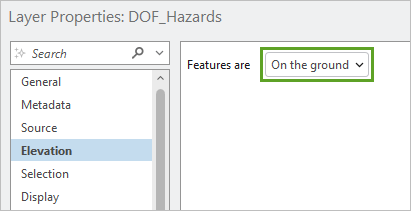
Setting this option ensures that your features are extruded from their base on the earth's surface.
- Click OK.
- If necessary, in the Contents pane, click the DOF_Hazards layer to select it.
- On the ribbon, click the Feature Layer tab. In the Extrusion group, click Type and choose Absolute Height.

- In the Extrusion group, for Field, choose Z. If necessary, for Unit, choose US Feet.
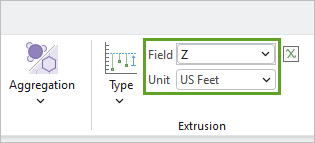
The Z field is the true height of the obstacle above the surface.
- In the Contents pane, right-click DOF_Hazards and choose Zoom To Layer.
The existing obstacle features are now extruded from the surface to their true height.

You can see the obstacles that penetrate the OIS. Zooming in on those obstacles gives you a sense of how much of a hazard these obstacles pose to aircraft using this runway. Existing obstacles typically must be removed, lowered, lighted, or otherwise mitigated to ensure safe operation of the airport.
Display construction hazards in 3D
You'll use the same method to symbolize the Construction_Hazards layer.
- In the Contents pane, right-click Construction_Hazards and choose Properties.
- On the Elevation tab, for Features are, choose On the ground. Click OK.
- If necessary, in the Contents pane, select the Construction_Hazards layer.
- On the ribbon, on the Feature Layer tab, in the Extrusion group, click Type and choose Absolute Height.
- For Field, choose Z. If necessary, for Unit, choose US Feet.
- In the Contents pane, right-click Construction_Hazards and choose Zoom To Layer.

The obstacle features are now extruded from the surface to their true height. You can see the obstacles that penetrate the OIS. Zooming in on those obstacles gives you a sense of how much of a hazard these obstacles pose to aircraft using this runway.
Highlight existing obstacles that pose a hazard
Next, you'll adjust the symbology of the existing obstacles to highlight those that present a flight hazard to aircraft. To show all the obstacles, you'll remove the definition query you set previously.
- In the Contents pane, double-click DOF_Hazards. In the Layer Properties window, on the Definition Query tab, point to Query 1 and click the Remove definition query button.

- Click Yes to confirm the removal. Click OK.
- In the Contents pane, right-click DOF_Hazards and choose Symbology.
- In the Symbology pane, for Primary symbology, choose Unique Values.
- For Field 1, click the Set an expression button.

The Expression Builder window appears.
The DOF_Hazards features that penetrate the OIS have a Delta_Z attribute greater than or equal to 0. You'll use an Arcade expression to change the symbology for these features based on whether they penetrate the OIS or not.
- In the Expression box, delete the existing expression and copy and paste the following Arcade script:
if ($feature.Delta_Z >= 0) {
    return "Penetrating"
}
else {
    return "Not penetrating"
}
- Click OK.
The Expression Builder closes and the DOF_Hazards feature layer is symbolized by penetrating and non-penetrating features.
- On the Symbology pane, click the symbol for the Not penetrating class.

- On the Gallery tab, click the green Non-penetrating Obstacles symbol.

- Click the Return to primary symbology page button.

- On the Symbology pane, click the symbol for the Penetrating class. On the Gallery tab, choose the red Penetrating Obstacles symbol.
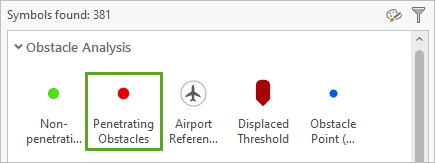
- Click the Return to primary symbology page button.
You have updated the Penetrating and Non penetrating symbols.

The existing hazard features that penetrate the OIS are now easier to see.
Highlight construction obstacles that pose a hazard
You'll use the same technique to adjust the symbology of the construction hazard obstacle features to highlight the obstacles that present a flight hazard to aircraft.
- Remove the definition query for the Construction_Hazards layer.
- In the Contents pane, confirm that the Construction_Hazards layer is selected.
- On the Symbology pane, for Primary symbology, choose Unique Values.
- Click the Set an expression button.
- In the Expression box, delete the existing expression and copy and paste the following Arcade script:
if ($feature.Delta_Z >= 0) {
    return "Penetrating"
}
else {
    return "Not penetrating"
}
- Click OK.
The DOF_Hazards layer is symbolized by penetrating and non-penetrating features.
- In the Symbology pane, change the symbol for the Not penetrating class to the green Non-penetrating Obstacles symbol.
- Change the symbol for the Penetrating class to the red Penetrating Obstacles symbol.
The proposed construction hazard features that penetrate the OIS are now easier to see.
- Close the Symbology pane.
Explore the scene
Next, you'll explore the scene in 3D to get a better sense of how much the obstacles penetrate the OIS.
- In the lower-left corner of the 3D view, click the Show full control button to see the expanded version of the 3D navigation controls.

- Click and drag the ring control up to change the perspective on the scene.

When the ring is horizontal, you see the scene as though you were standing on the surface.

You can also navigate by clicking and dragging the scene.
- Right-click the Construction_Hazards layer and choose Zoom To Layer.
- Use the 3D navigation controls to view the hazards.

Now you can see how some of the obstacles do not touch the OIS, while the two nearest the runway penetrate it. You can use these visualizations to illustrate to the construction team which crane positions pose a potential hazard to aircraft.
- Save the project.
In the tutorial, you assumed the role of a GIS analyst for SFO to analyze obstacles at the end of runway 10L. Obstacle analysis is a critical exercise for ensuring the safe travel of aircraft in and around an airfield. You loaded and analyzed aviation data using geoprocessing tools from the ArcGIS Aviation Airports toolset and you visualized the results in both 2D and 3D.
You can find more tutorials in the tutorial gallery.

