Create the downstream flow path from the storm drain
The key locations in the analysis are a school, a drainage ditch, and a storm drain.
Open a map
You'll open a map, add a layer for analysis, and identify landmarks.
- Sign in to your ArcGIS organizational account.
Note:
If you don't have an organizational account, see options for software access.
- On the ribbon, click the Map tab.

Map Viewer opens.
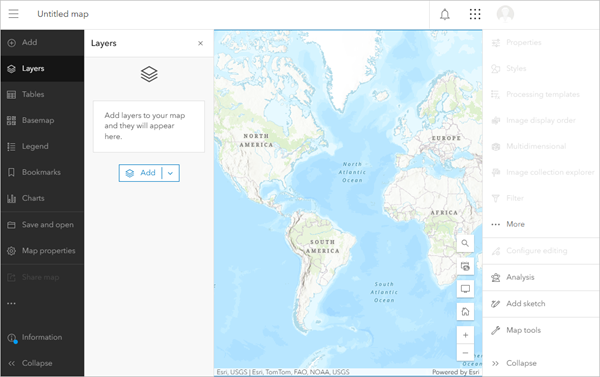
Next, you'll add a layer that will be used for analysis. It is the location of a storm drain.
- On the Contents (dark) toolbar, click Layers. In the Layers pane, click Add.
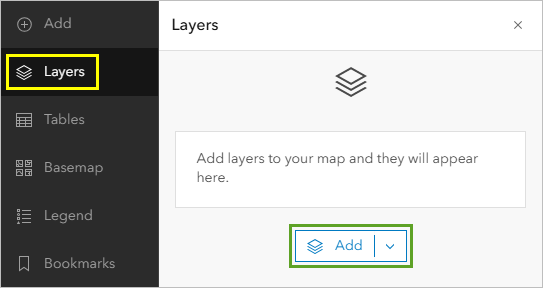
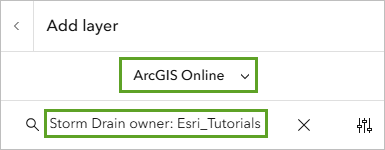
You'll search for the layer to add to your map.
- Click My Content, and choose ArcGIS Online. In the search, type Storm Drain owner: Esri_Tutorials.
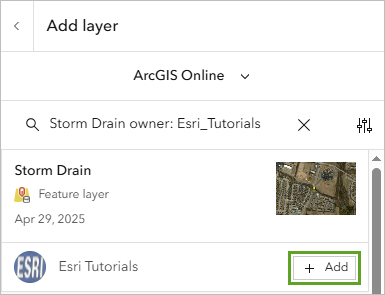
- Find the Storm Drain layer owned by Esri Tutorials and click Add.
The layer is added to the map. It is a single point represented as a yellow square.
- Use Zoom and Pan to zoom to the point on the map.
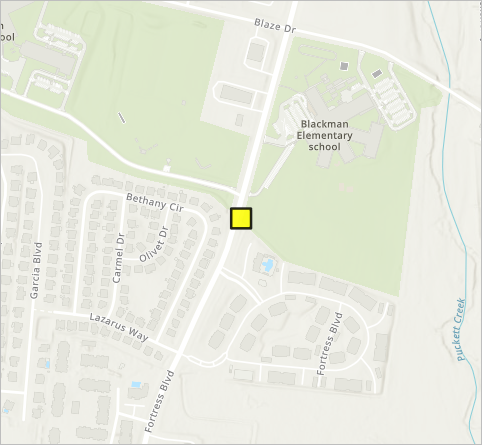
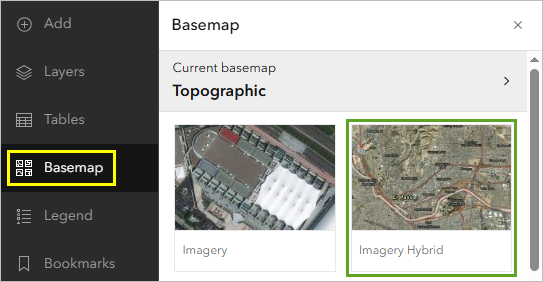
Next, you'll change the basemap to show aerial imagery. This provides better context for the area you'll be studying.
- On the Contents toolbar, click Basemap. In the Basemap pane, choose Imagery Hybrid.
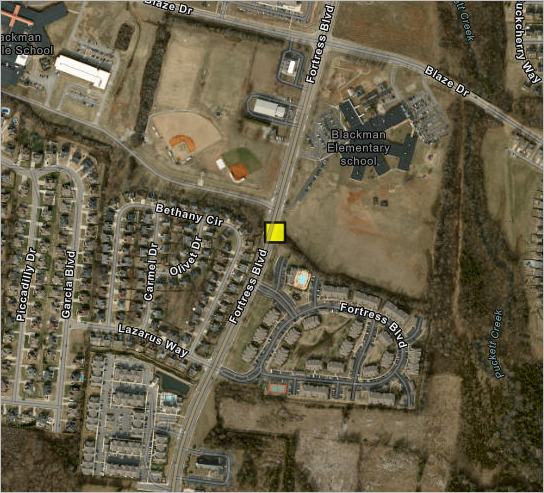
The map updates to show the location of the storm drain with aerial imagery.
Locate the school, drainage ditch, and storm drain
You'll use zoom and pan tools to locate features on the map.
- Look at the map.
The elementary school is the large building just northeast of the yellow marker.

- Use Zoom and Pan to show the elementary school on your map.
Due south of the school building is a long row of trees and bushes. They grow along a drainage ditch, which is part of a storm sewer system designed to carry storm water to rivers and ponds and other water bodies to prevent flooding of roads, homes, and school yards.
- Zoom in to where the row of trees and bushes intersects with Fortress Blvd.
There's a square yellow symbol there on the map.
The yellow symbol indicates where there are two storm drains that collect storm water from the road that flows into the drainage ditch. If you want to see what the drains look like, there's a pair just like them on the other side of the road.

The two storm drains marked by the yellow square are the ones you'll be asking questions about. First, you'll ask, Where does the water that goes into the storm drain go? What route does it take to its destination? Before you start your analysis, you'll save the map.
Save the map
You'll save your map to your ArcGIS Online account.
- On the Contents toolbar, click the Save and Open button and choose Save as.

- In the Save map window, enter the following:
- For Title, type Storm Drain Analysis.
- For Summary, type Map of the flow path and watershed analysis for a storm drain near Blackman Elementary School, Murfreesboro, TN.

- Click Save.
You've saved the map to your account. Next, you'll start your analysis.
Find the downstream flow path from the storm drain
You identified the location of a storm drain near Blackman Elementary School and saved your map. Next, you'll create a trace, or flow path, showing where the water goes from that storm drain.
You'll use the Trace Downstream tool to find the downstream flow path. This tool uses a Digital Elevation Model, or DEM, to create the flow path. A DEM is a 3D map of the earth's surface. It includes the location of hills and valleys and can help predict where water will flow. Unfortunately, it's not a dataset that you can look at, but it plays a key role in the analysis.
- On the Settings (light) toolbar, click the Analysis button. In the Analysis pane, click Tools.

- On the Tools tab, expand Find locations and choose Trace Downstream.

- In the Trace Downstream pane, for Input point features, click Layer and choose Storm Drain.

The Storm Drain layer includes just one point indicating the location of the storm drain near the elementary school.
- If necessary, scroll down in the Trace Downstream pane so you can see Result layer. For Output line name, type Storm drain trace and add your name or initials.
Note:
You cannot create two layers in an ArcGIS organization with the same name. Adding your initials to a layer name ensures that other people in your organization can also complete this tutorial. Once a layer has been created, you can rename it in the map to remove your initials, which will not affect the name of the underlying data layer.

- Click Run.
When the analysis is complete, the trace line is added to the map and appears in the Layers pane.

The storm water travels down the drainage ditch and into Puckett Creek, which flows north around the elementary school. Where does it go from there?
- On the Contents toolbar, click the Layers button.
- In the Layers pane, for the Storm drain trace layer, click the Options button, and choose Zoom to layer.

The map zooms out to show the entire trace.

From Puckett Creek, the flow path connects to the Cumberland River. The path meanders west through Nashville and then flows north to connect with the Ohio River. Once it connects to the Mississippi River, the path flows to New Orleans and enters the Gulf of Mexico at the mouth of the Mississippi. In all, it touches the border of, or passes through seven states, two major rivers, two large lakes, and a number of smaller lakes and rivers. The route is more than 1,200 miles.
- Zoom to the yellow square representing the storm drain. Save the map.
You have identified the path storm water takes from Murfreesboro to the Gulf of Mexico. Next, you'll ask a different question: Where does the water come from that falls into the storm drain near Blackman Elementary School?
Create a watershed that feeds the storm drain
You created a trace to see where the water from the storm drain flows. Next, you'll use the Create Watersheds tool to identify the upstream contributing areas for the storm drain.
Create a watershed
You'll create a watershed for the region near Blackman Elementary School. First, you'll prepare the map.
- In the Layers pane, point to the Storm drain trace layer and click the Visibility button to turn the layer off.

- In the Trace Downstream pane, click the Back button to return to the Tools pane.

- On the Tools pane, expand Find locations and choose Create Watersheds.

The Create Watersheds pane appears. The Create Watersheds tool, like the Trace Downstream tool, uses a DEM. The Create Watersheds tool identifies the area that drains to a specific location. You'll set a search distance in miles, 0.5 miles, to tell the model how far to look for possible inputs.
- In the Create Watersheds pane, fill in these values:
- For Input point features, click Layer and choose Storm Drain.
- For Search distance, type 0.5. For Distance units, choose Miles.
- For Output polygon name, type Upstream Watershed and add your name or initials.
- Click Run.
When the analysis is complete, the watershed area is added to the map and appears in the Layers pane.

It's difficult to see the yellow marker locating the storm drain. You'll move the storm drain layer on top of the watershed layer.
- In the Layers pane, drag the Storm Drain layer to the top of the layer list.

Next, you'll have a look at the extent of the watershed that flows into the storm drain.
- Point to the Upstream Watershed group and click the Expand button.

- Point to the WatershedFeatures layer, click the Options button, and choose Zoom to layer.

The map zooms to the extent of the watershed.

- Click the watershed on the map.
The pop-up appears.
- Review the pop-up information.

The watershed contributing storm water to the storm drain near Blackman Elementary School covers more than 21 square miles (55 kilometers).
Note:
The underlying data used in this tutorial is updated periodically so the values may vary from the example image.
- In the pop-up window, click the Close button.
- Save your map.
You have identified the area that contributes water (and perhaps other things) to the storm drain near Blackman Elementary School.
In this tutorial, you traced where the water collected by a storm drain in Murfreesboro, Tennessee, travels on its way to the ocean. You also created a watershed map to show the area that drains into the storm drain.
Note:
Try repeating these workflows for other storm drains or other places in the environment. Because the data underlying the tools in the tutorial is available nearly worldwide, you can try many locations of interest. Remember that to do the analyses you must create a layer with the location of interest. That can be a single point on a sketch layer or a feature layer. Consider a location near the Chicago River; the river direction was reversed in 1900 and now flows toward the Mississippi River and into the Gulf of Mexico rather than into Lake Michigan.
You can find more tutorials in the tutorial gallery.
