Map terrain with profile views
The earliest maps depicted terrain as drawings of hills and mountains. This is a useful method because it is easy for people to understand. But it is also a limited method that can't depict landforms with much accuracy. In this first activity, your students will build mountains out of clay and draw profile views of them.
Model mountains with clay
Your students will each create a clay mountain that they will map throughout this tutorial.
- Gather all of the supplies listed in the Requirements section.
- Open the History of Terrain Mapping web map and connect it to a projector or other screen that all of your students can see.
- Give each student a piece of heavy paper (cardstock) and a pencil.
- Ask them to write Elevation Mapping, their name, and the date at the top of their paper.
The students can orient the page vertically or horizontally.
- Give each student some clay and ask them to make a mountain with it on their paper.
The mountain should be centered on their page. Direct the students to make the most realistic mountain possible. They will have the most fun with this project if their mountain has a variety of forms:
- Gradual slopes and cliffs.
- Multiple peaks of different heights.
- Peaks of different shapes—they should not all be perfect cones.
Students can add a cave to their mountain, although you should warn them that it will present some challenges later.
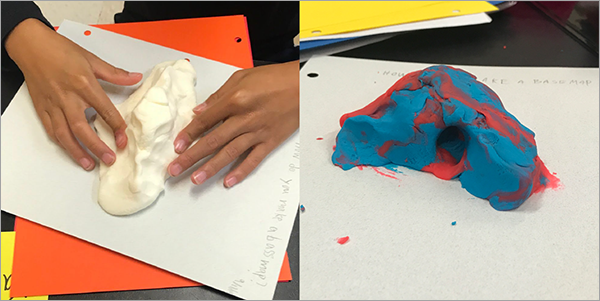
- As the students work, make your own mountain on a piece of paper under the document camera.
As they work, you'll ask your students some questions.
- Ask if they know what the word topography means.
Topography is the bumpy and uneven surface of the earth. The earth is not smooth; it has many different landforms such as hills and mountains and valleys.
- Can you name some other landforms?
Some examples of landforms are canyon, pit, peak, channel, plain, slope, mountain pass, ridge, cliff, mesa, crater, fjord, ravine, and plateau.
All of these landforms make up the earth's terrain.
Note:
The word topography actually includes more than just landforms. It also includes natural features such as rivers and forests and cultural features such as towns and roads—all of the things you would find on a topographic map. But the word is often used in a narrower sense to only refer to terrain.
- What is the terrain like where you live? Is it mountainous or flat?
- How do you think the first mapmakers decided to draw terrain?
Explore a historical map with mountains drawn in profile
Next. your students will examine a map that depicts terrain with profile drawings of hills and mountains.
- Switch from your document camera view to the History of Terrain Mapping web map.
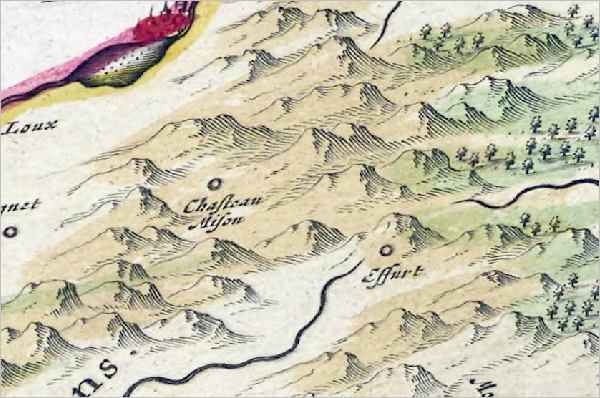
This map was made by Joan Blaeu in 1665.
- Ask students if they can guess where in the world this map is. On the lower right of the map, click Zoom out until they guess or until labels appear.

This is a map of part of Switzerland.
Note:
The map appears skewed because it has been georeferenced onto a contemporary map. You can see the original map and read more about it at the David Rumsey Map Collection.
- On the Contents (dark) toolbar, at the bottom, click the Expand button.

- Click Bookmarks and choose Lac de Neuchâtel to return to the original view.
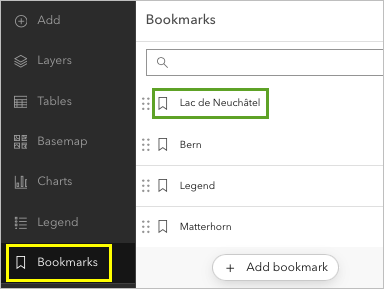
You'll ask your students some more questions about this map.
- Why do you think the mapmaker drew hills this way?
In the 1600s, there was no way to fly or get a bird's-eye view of the terrain.
- Where do you think the mapmaker was standing when they drew these hills?
Your students may guess that they were standing on another mountain or a tower.
- Do you think these hills are accurate? Why or why not?
- Have you seen mountains drawn in this way on other maps, including modern maps?
Hill drawings are often used in pictorial maps.
Here is an example of a pictorial map of Switzerland made for tourists. The landforms were drawn by Eduard Imhof, a famous Swiss cartographer (mapmaker).
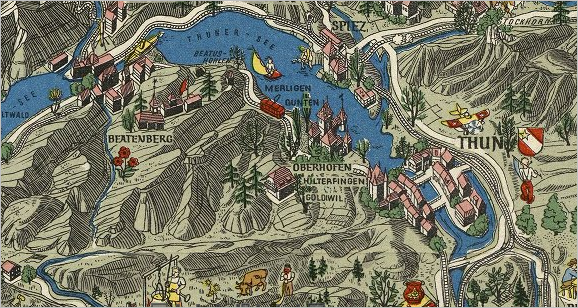
- Why do you think profile mountain views are still common for tourism maps?
They are not as accurate, but they are attractive and spark the imagination.
When they are drawn well, hill drawings create an intuitive view of a landscape and can help newcomers navigate with visual landmarks.
Draw mountains with profile views
Next, you'll get the students to map their clay mountains by drawing profile views.
- Ask students to move to eye-level with their mountains and draw a profile view on their cardstock.

While they draw, you'll guide discussion about the maps they just saw.
- What was the first technology humans developed to get higher than a mountain, into the air?
The hot air balloon, invented in 1783.
- How do you think this invention would change mapmaking?
Mapmakers can now see a bird's-eye view of the land.
- How would you represent a hill or mountain if you were looking straight down at it?
Students will have more difficulty answering this question. In the next steps, you'll show them one method that mapmakers used.
Map terrain with hachures
Even after the hot air balloon was invented, cartographers still didn't have a reliable way to look down on mountains from above. But they found ways to map the terrain as though they had. For a long time, the most popular method for doing this was hachures. Next, your students will draw hachures on their clay mountains and reproduce these marks on the paper to make a map of their mountain.
Explore a historical map with hachures
Your students will return to Switzerland to explore the same landscape drawn with hachures instead of hill drawings.
- If necessary, open the History of Terrain Mapping web map.
- On the Contents (dark) toolbar, click Layers to open the Layers pane.
- In the Layers pane, point to the layer named Mayr's Alpenkarte. Click the Visibility button to turn on the layer.
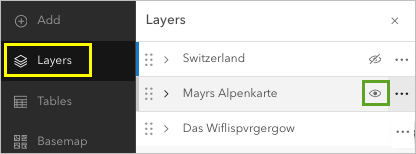
A new map appears.
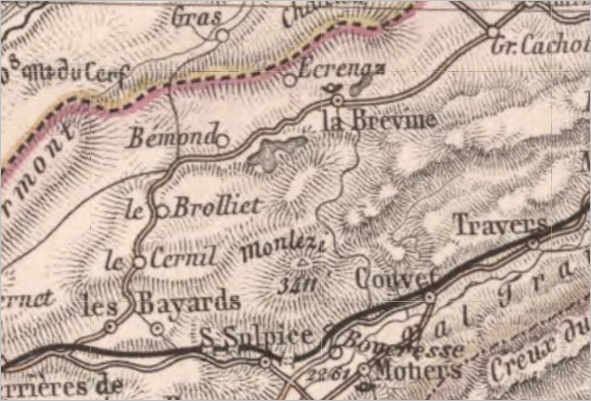
This is part of a map made by Adolf Stieler in 1872. You can learn more about it at the David Rumsey Map Collection.
- How would you describe the marks on the sides of the hills?
They look like lines, shading, or scratches. These marks are called hachures.
- Ask if anyone can come up to the screen and point to the top of a hill or mountain.
Some of the mountain peaks have a triangle symbol on them with a number. That is the height of the mountain. Before, cartographers were just drawing the shapes of the terrain. Now they are measuring the heights of mountains and trying to depict them accurately on their maps. They are mapping the elevation, the heights of the landforms.
Map mountains with hachures
Your students will draw hachures directly onto their clay mountains and draw a map in this style.
- Ask your students to use their #2 pencils to scrape hachures onto the sides of their clay mountains.
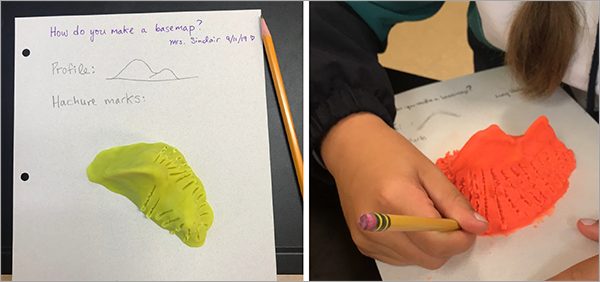
- When they have finished marking the clay, ask the students to stand above their mountains looking straight down at the peaks. Ask them to draw what they see, hachures and all.
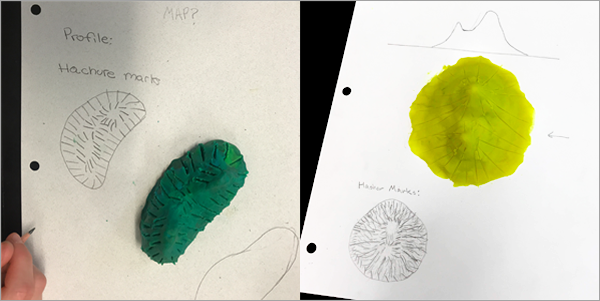
- Ask the students if they can think of some advantages of mapping mountains with hachures instead of profile views.
With hachures, you can map all sides of the mountain, instead of just one. Drawings of tall mountains won't hide other things that might be behind them on the map.
- Ask the students to raise their hands for the following questions:
- Who thinks hachures are the best way to map terrain?
- Who thinks there must be an even better way to map terrain?
- Ask a few of the students to describe their idea of a better terrain mapping technique.
Some students may describe contour maps that they've seen. Some may describe imagery captured by satellites or airplanes. Next, your students will map their mountains with contour lines.
Map terrain with contour lines
Hachures were used on maps for a long time, but they are rarely seen on maps made today. This method of terrain mapping was replaced by contour lines. Your students will use contour lines next to map their clay mountains.
Explore a historical map with contours
You'll guide your students through one more historical map of Switzerland.
- If necessary, open the History of Terrain Mapping web map.
- On the Layers pane, point to the Switzerland layer and click the Visibility button to turn it on. Point to the Mayr's Alpenkarte and Das Wiflispvrgergow layers in turn, and click the Visibility button to turn each one off.
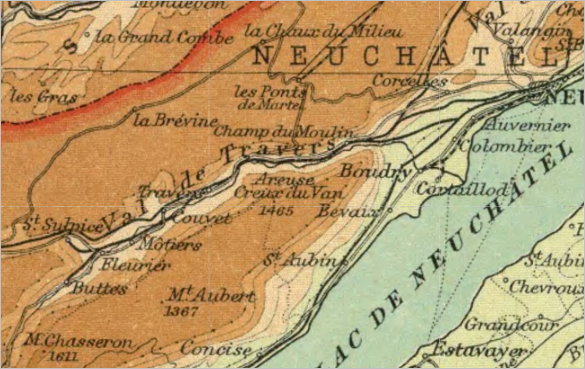
This map was made by John Bartholomew in 1922. You can learn more about it at the David Rumsey Map Collection.
- Pan and zoom to explore the map with your students.
- Has anyone seen a map like this before? Where?
- What do the lines between the colors mean?
These are called contour lines. They trace areas of similar elevation.
- On the Contents toolbar, click Bookmarks and click the Bern bookmark. Ask the students if they can point to a hilltop or mountain peak.
These appear as closed circles on contour maps.
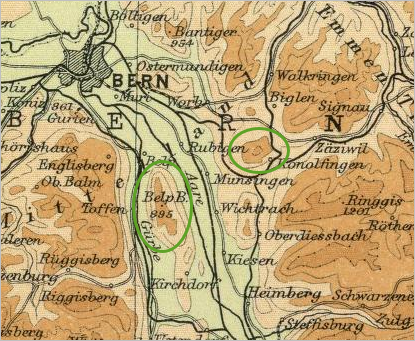
- What do the colors mean between the contour lines?
The colors make it easier for you to know which elevation level you are on, without having to count the contour lines.
- Click the Legend bookmark.
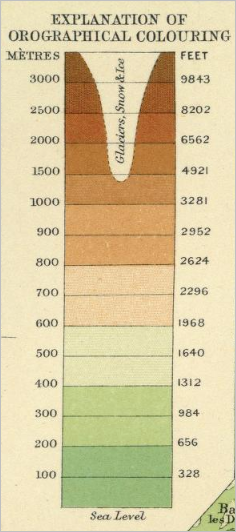
Green colors are for lowlands and brown colors are for higher elevations.
- Do the colors on the map match the colors on the earth?
Not always. The colors are meant to make it easier to see changes in elevation.
- Click the Matterhorn bookmark. Some places on the map are white. Why is that?
- Click Layers and point to the Switzerland layer. Click the Visibility button to turn the layer off and reveal satellite imagery underneath.
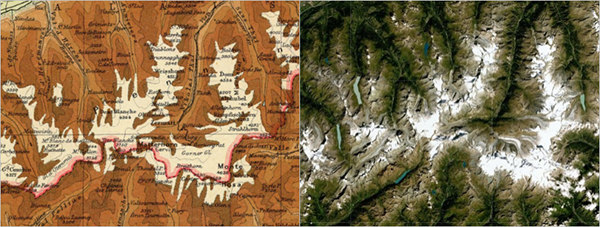
The white area represents snow and ice on the tops of mountains.
- Point to the Switzerland layer and click the Visibility button to turn the layer back on.
Map elevation with contour lines
Next, your students will cut their clay mountains into slices and trace them to make a contour map. You'll demonstrate the process for them first.
Tip:
Allow your students to watch you work without explaining the whole process first. As they watch, they will anticipate the next step. At some point, they will probably shout "I get it!"
- Gather your students around your desk or table so they can all see what you’re doing.
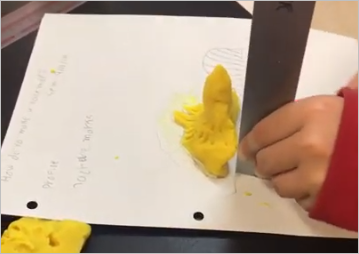
- Use a ruler to measure and mark 1 cm above the base of your clay mountain.
Tip:
Many rulers have a rounded end with some blank space before measurement marks begin. Try to find square-ended rulers that start at 0.
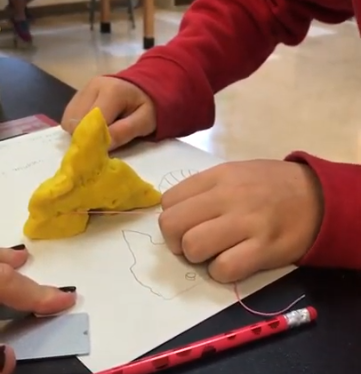
- Use a string to slice through your mountain at the 1 cm mark.
Note:
You can use any interval. One cm works well when each student has 4–8 oz (113-227 g) of clay.
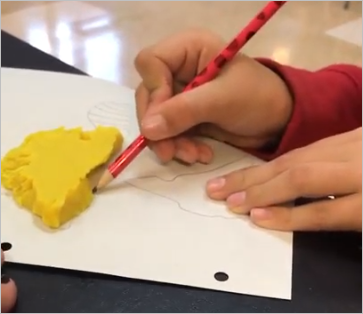
- Set aside the top of the mountain and use a pencil to trace the base of your clay mountain.
- Use a stiff ruler to scrape the bottom part of the mountain off the paper.
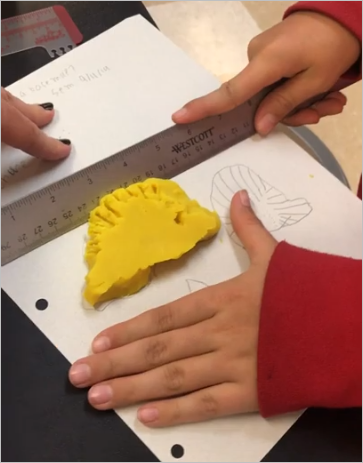
- Place the top part of the mountain back on the paper and trace it.

- Measure 1 cm from the base of the clay and repeat the process.
- Send your students back to their desks with a ruler and a piece of string. Instruct them to map their own mountains in this way.
They should continue cutting and tracing slices until their clay mountain is all used up.
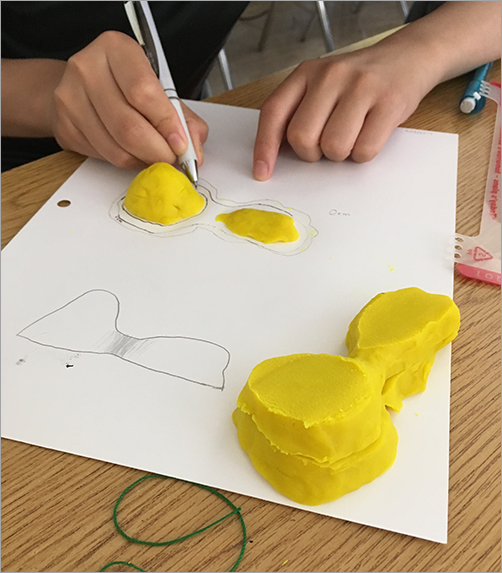
Tip:
Encourage your students work in pairs to help each other cut up their mountains. They are easier to slice when someone else holds the top. Otherwise, the mountains may get squished.
- When the students finish tracing their mountains, ask them to label each contour ring with its elevation—, for example, 0 cm, 1 cm, 2 cm, and so on.
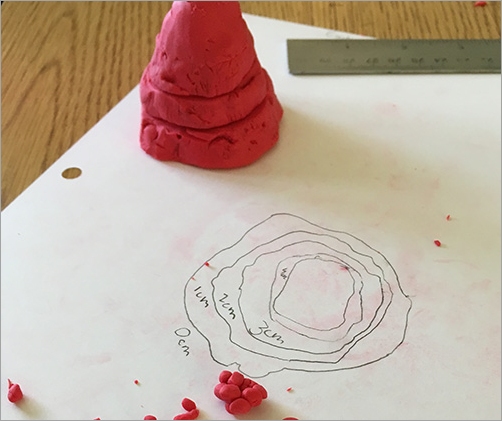
Next, the students will color their contour maps.
- Ask your students to color their maps using a progression of colors—a color ramp—that shows low to high elevations.
Tip:
The paper may be gummy from the clay. Colored pencils work best for coloring on the gummy paper. If you don't have colored pencils, you can skip to the next step. You can also tell your students that not all contour maps use color. Granville sheet is an example of a contour map with only lines.
An elevation color ramp sometimes tries to imitate the landscape. In the map of Switzerland, lowlands were green and high areas were brown. If you were mapping mountains in a desert, would you use the same color scheme?
No. If you made a map that showed the lowlands of a desert as green, it would be misleading.
A color ramp might be monochromatic, so it only uses shades of one color. In New York Elevation, 1895, the map at the upper right is an example of a monochromatic color ramp used for elevation.
Elevation color ramps are more often multicolored. Shikotsu, Toya and vicinity uses a color ramp similar to the one used in the map of Switzerland. Canada – British Columbia, and Prairie Provinces uses a wider range of colors, including blues for mapping ocean depths.

Tip:
Depending on the gumminess of the paper, you can direct your students to color their maps and make a legend, instead of adding labels.
Your students now have three different maps of their mountain: a profile view, a hachure map, and a contour map.
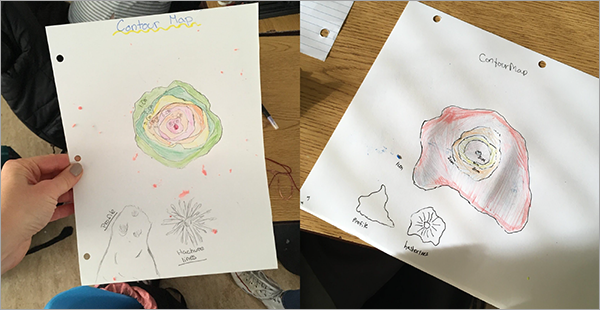
Students can also color their profile map to match their contour map. What becomes obvious?
Reflection
After cleaning up, end the class with some reflection on the activity. If you don't have time for reflection, return to it during the next class.
- What did your contour lines look like if you had a steep slope or cliff?
The contour lines are drawn close together.
- What did your contour lines look like if you had a gentle slope?
The contour lines are drawn far apart.
- Did anyone have a cave or another tricky feature? How did this affect the lines on your contour map?
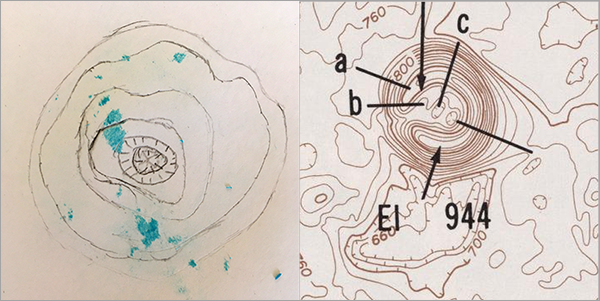
- Did anyone have a depression in their mountain? This might be a lake or the crater of a volcano, for example.
A depression can be difficult to draw on a contour map, since it will be a closed circle, just like a mountain peak. Labels and colors help make it clear that these are lower elevations, not higher.
On maps without coloring, depression contours are drawn with a hatched line symbol to help people recognize them. The image below shows depression contours on a student’s map and on a map of a cinder cone from the David Rumsey Map Collection.
- We can’t cut up a real mountain. How do you think mapmakers figured out the contour mapping system?
They had to measure the elevation at different points on the ground. Then, on their map, they connected the points of equal value to draw contour lines.
You can learn how to draw contour lines from elevation points in this activity: Connect-the-dots.
Interpret contour maps (optional)
Now that your students have mapped terrain in three different ways, they should be skilled map readers. You can use this optional activity in the next class to assess your students' understanding of contour maps.
Label landforms on topographic maps
You'll provide your students with some topographic maps and ask them to label landforms.
- Gather some printed topographic maps with contour lines. If you can't find any, you can use maps from the Atlas of Landforms from the David Rumsey Map Collection.
- Lay the topographic maps on tables throughout the classroom.
- Give each student several small sticky notes.
Tip:
If the sticky notes are too large, cut them into smaller strips.
- Ask the students to label each strip with the name of a landform, for example, peak, valley, stream, cliff, plateau, gentle slope, and so on.
Have them include an arrow on each strip so it can point to the landform it is labeling.
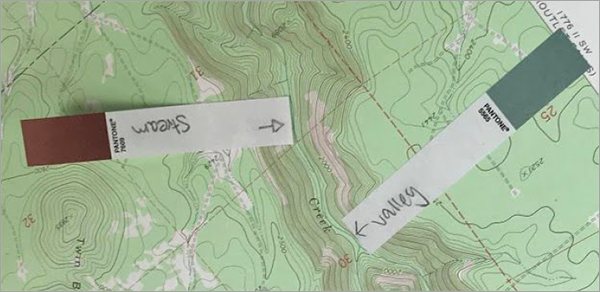
- The students also need to write their names on the back of each sticky strip.
- Ask the students to walk around and stick their notes on matching landforms on the maps.
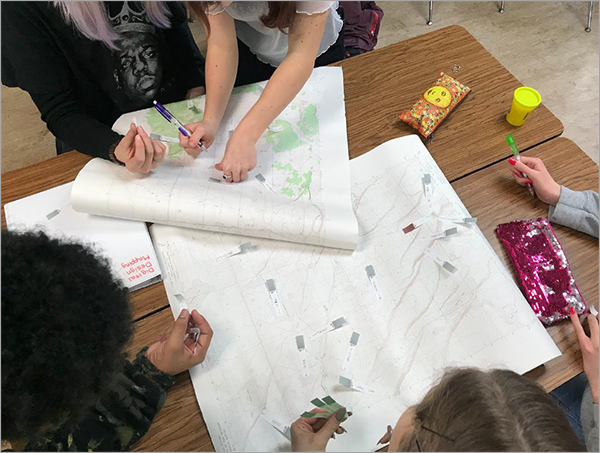
- Walk around and check for any incorrectly labeled landforms.
If you find one, check the back of the sticky note. Call that student, give them a clue, and ask them to try again.
In this activity, students get feedback not just from you but also from watching each other.
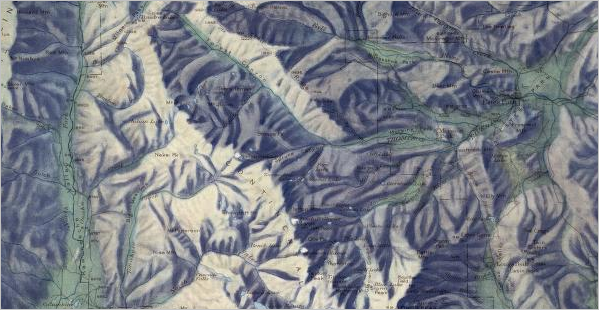
In this tutorial, your students learned about three steps in the evolution of mapping terrain. After contour maps, another technique was developed, called hillshading. When a cartographer uses hillshading, they draw a view of the terrain from above, as it might appear with the sun shining on it from an angle. Some mountain slopes are lit, and other are in shadow.
You can see an example of hillshading in this map of Rocky Mountain National Park in the United States.
If some of your students finish their activity early or want to learn more, they can watch this video of cartographer Sarah Bell explaining how she draws color hillshade.
Today, contour lines and hillshading can be created automatically using digital software such as ArcGIS Pro, if you have data for elevation measurements. But mapping terrain by hand gives your students a clear sense of how to interpret terrain on any maps they read.
Terrain is one element of a basemap, which is the first layer of a GIS. Finding and navigating maps in ArcGIS Online is a short video and activity that you or your students can use to explore basemaps in a GIS.
You can find more tutorials in the tutorial gallery.

