Make an equal-area web map
Your first client is doing some geologic mapping and wants you to make a web map that shows fault data for Colombia, along with global tectonic plates. You've already made this map using data from ArcGIS Living Atlas of the World, but you are concerned that the sizes of the plates are distorted by the default projection. All map projections distort the earth in some way, so it is important to choose one that does not distort the features that are most important to your particular map. For this map, you'll apply an equal-area projection to show the sizes of the tectonic plates accurately.
Find a basemap with an equal-area projection
You can make a web map with any projection. However, tiled layers (including basemaps) can't be reprojected, so in many projects, you will have to decide which is more important: a detailed ready-made basemap or an appropriate map projection.
- Open the Tectonic Plates web map.
- At the top of the page, click Sign In and sign in to your ArcGIS account.
Note:
If you don't have an organizational account, see options for software access.
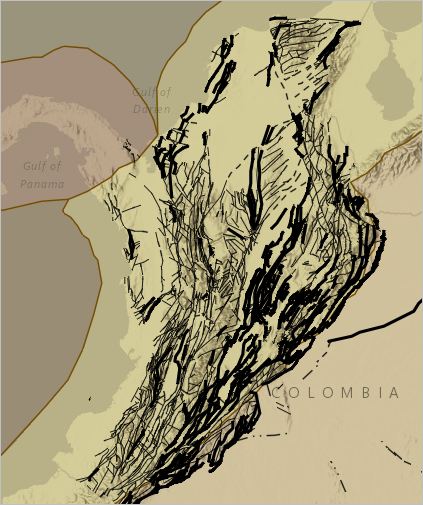
The map shows fault lines in Colombia.
- Zoom out until you can see the entire world.
This map also shows tectonic plates—pieces of the earth's crust.
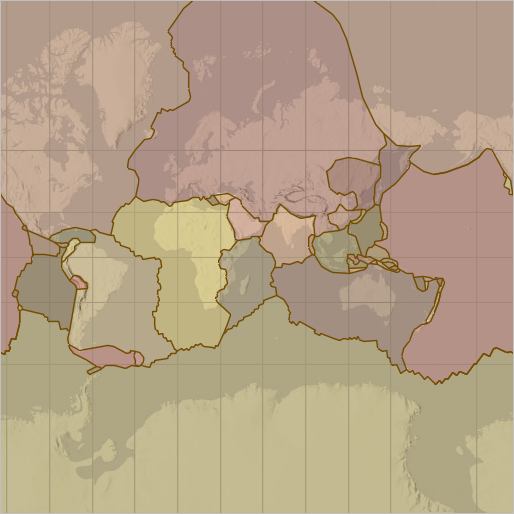
This map uses the Web Mercator projection. The graticule lines on this map demonstrate how Web Mercator distorts area. Space is stretched vertically the farther away it is from the equator. The Africa plate is larger than the North America plate, but it appears much smaller on this map.
You're not sure whether your client is aware of the area distortion that exists in some map projections. You're concerned that the people who will use this map may misunderstand it and draw false conclusions. Next, you'll change this map to use an equal-area projection, so the relative sizes of the plates are portrayed accurately.
- Zoom back to Colombia.
- On the Contents (dark) toolbar, click the Expand button.
To change the map's projection, you need to change the basemap. The projection of a web map is determined by its basemap.
- On the Contents toolbar, click Basemap.
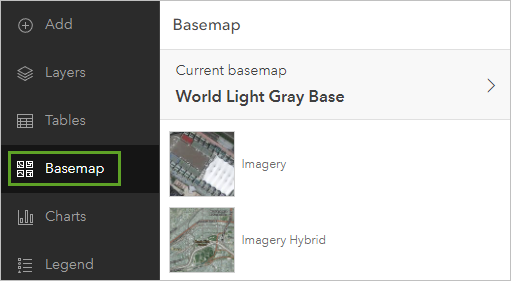
- Click some of the options in the list of available basemaps. The map updates, but it does not change its shape. This is because all of these basemaps use the Web Mercator projection.
- Scroll to the bottom of the list and click Living Atlas.
More basemap options appear.
Note:
You need to be signed in to your ArcGIS account to access ArcGIS Living Atlas basemaps.
- In the search bar, type equal area global web map and press Enter.
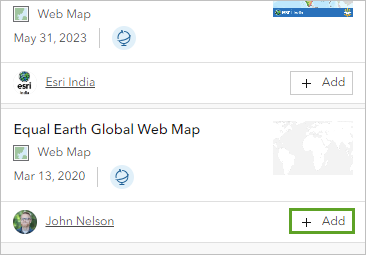
- Scroll down and find the Equal Earth Global Web Map item by j_nelson and click the Add button.
Equal Earth is an equal-area projection for world maps.
The appearance of the map changes. The map's labels and hillshade disappear, and the shape of the continents and tectonic plates change.
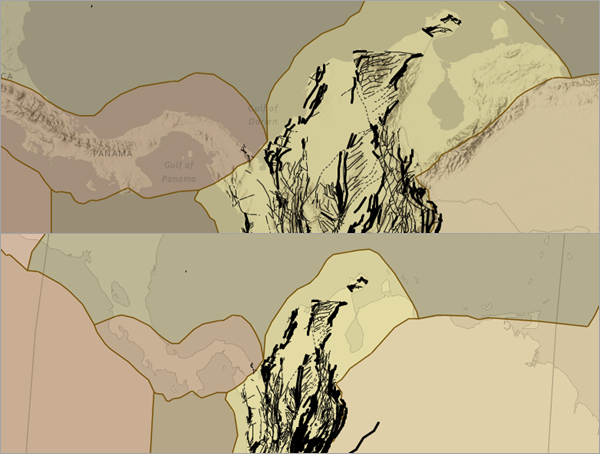
The labels have disappeared because they were part of the previous basemap. The new basemap has no labels.
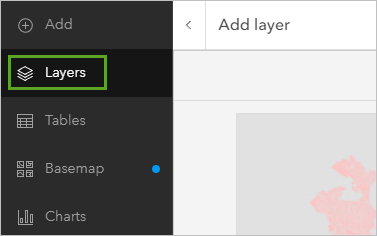
- On the Contents toolbar, click Layers.
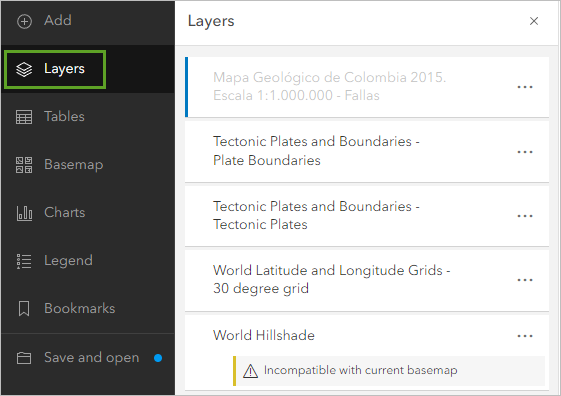
The Layers pane appears. All of the map's layers (except for the basemap layers) are listed here. One of them, World Hillshade, displays an error, which says that this layer is incompatible with the current basemap.
- In the Layers pane, point to the World Hillshade layer and click the Options button. In the menu that appears, click Show properties.
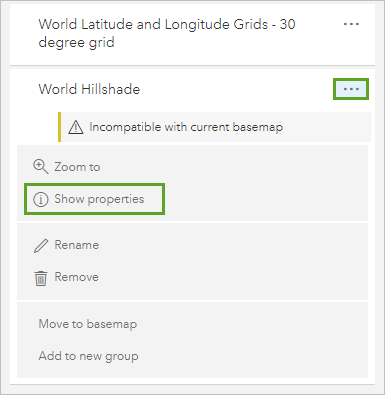
The Properties pane for the World Hillshade layer appears.
- In the Properties pane, click Information and find the layer type listed under the layer's name.
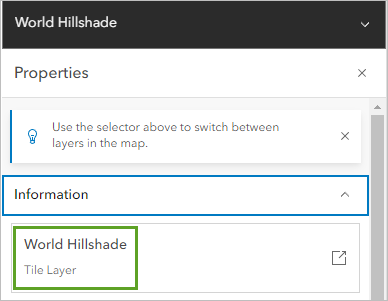
World Hillshade is a tile layer. Tile layers (which include basemaps) cannot be reprojected in a web map. This means you have to decide which is more important to your map: the hillshade layer or an equal-area projection.
In this case, you decided that the projection was more important, so you will remove the hIllshade layer.
- In the Layers pane, on the World Hillshade layer, click the Options button again and click Remove.
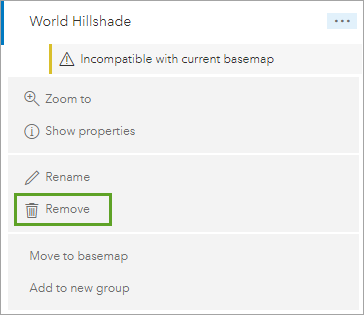
- On the map, zoom out until you can see the whole world.
The entire map has changed shape. The latitude lines are curved, and the Africa tectonic plate appears at the proper size.
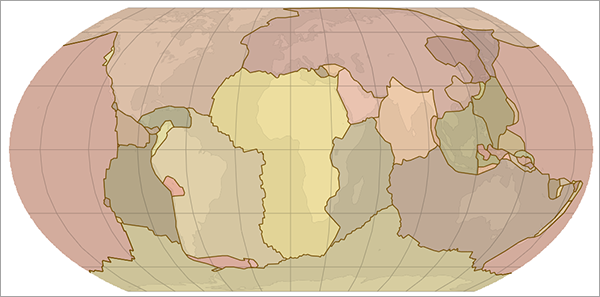
The Equal Earth projection distorts shapes, especially near its edges, but areas are presented accurately, which is more important for this particular map. All map projections distort the earth in some way. It is important to choose a projection that will preserve the qualities most important to the area of interest, the scale, and the purpose of your map.
- On the Contents toolbar, click Save and open and click Save as.
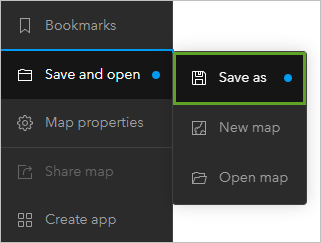
- For Title, type Tectonic Plates and click Save.
You've now made a web map using an equal-area projection. You changed the projection of the map by changing the basemap. But what if you needed to use a projection that was not available among existing basemaps? Next, you'll learn how to build and share your own basemap, in a projection of your choice.
Make a custom basemap in ArcGIS Pro
Your next client is a utilities company. They've requested a series of interactive maps that they can use for managing upcoming projects, and they require all maps to use the MAGNA coordinate system. This will ensure that the maps you make are completely consistent with any other maps or geographic data that they use. Utilities mapping is done at a large scale (zoomed in), so mixing coordinate systems may result in real location inaccuracies for your client.
Change the projection of the map
You've already found data from ArcGIS Living Atlas of the World and styled it in ArcGIS Pro to make a basemap. Next, you need to change the map's coordinate system.
- Download the Bogotá project package.
- Locate the downloaded Bogotá.ppkx file on your computer. Double-click the file to open it in ArcGIS Pro. If prompted, sign in to your ArcGIS account.
Note:
If you don't have access to ArcGIS Pro or an ArcGIS organizational account, see options for software access.
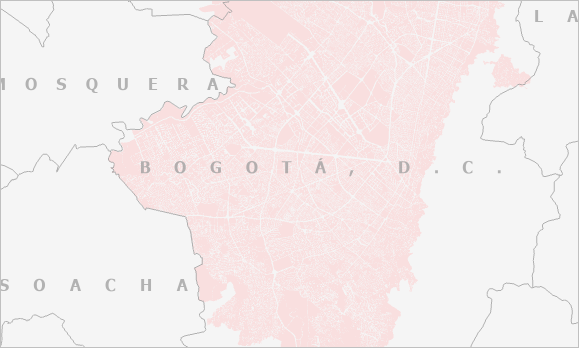
The map shows blocks for the city of Bogotá and Colombia's municipalities.
- In the Contents pane, right-click Bogotá and choose Properties.
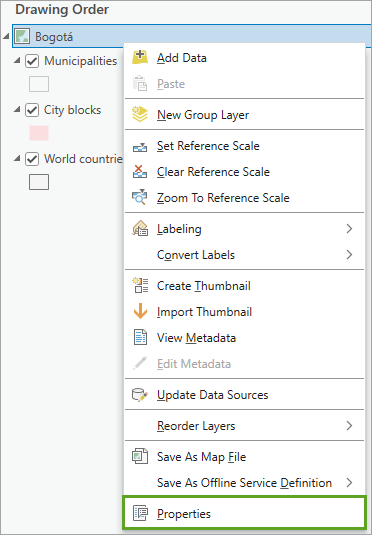
- In the Map Properties window, click the Coordinate Systems tab.
Coordinate systems relate locations on your map to locations on the earth. They are often colloquially referred to as projections, but in fact, projections are just one part of a projected coordinate system. The projection is the part that tells your map how to draw the round earth on a flat surface.
The Current XY box tells you that the map's coordinate system is set to WGS 1984 Web Mercator (auxiliary sphere).
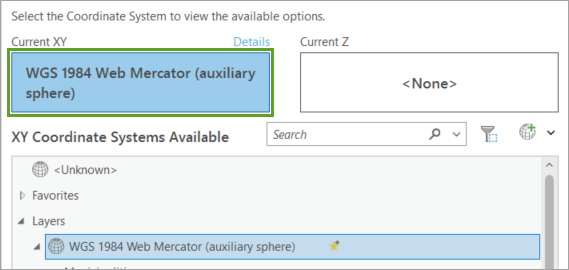
Web Mercator is actually a projected coordinate system that uses a projection called Mercator Auxiliary Sphere.
Note:
You can learn more about coordinate systems in the Geographic vs Projected Coordinate Systems blog article and the Coordinate systems, projections, and transformations help topic.
Next, you'll change the coordinate system of your map to the one requested by your client.
- In the XY Coordinate Systems Available list, expand Projected Coordinate System.
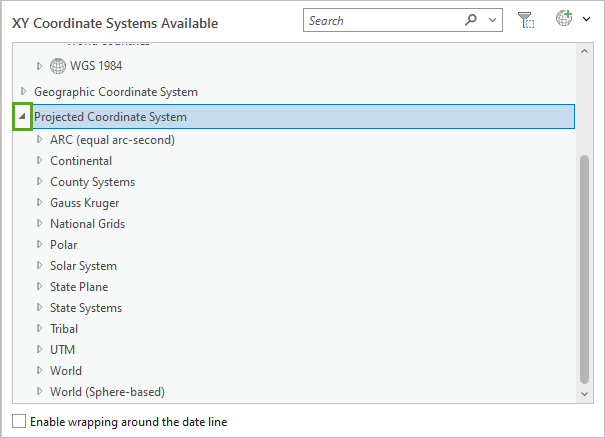
You can find the coordinate system that you need and select it from this list. But to make sure you're using exactly the right one, you'll import the coordinate system from some of the data that your client provided.
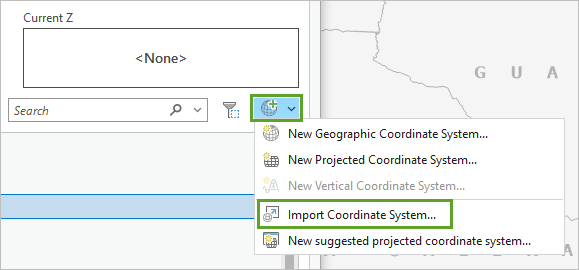
- Click the Add Coordinate System button and choose Import Coordinate System.
- In the Import coordinate system window, expand Databases. Click Bogotá.gdb and select the Rios feature class.
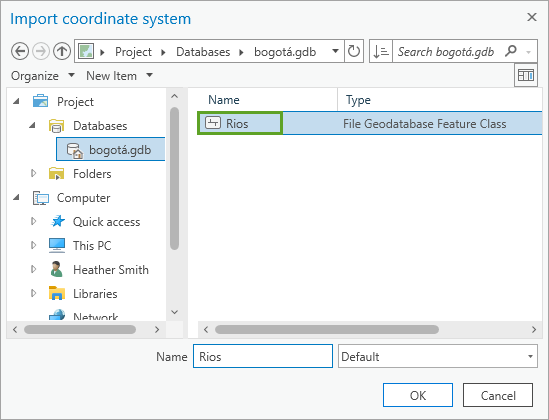
- Click OK.
- Confirm that the Current XY button has updated to MAGNA Colombia Bogota.

- Click OK.
The map redraws. It looks similar to before, but now everything is drawing with the MAGNA Colombia Bogota projected coordinate system, instead of Web Mercator.
Style the map for different scales
Your map now meets your client's requirement, but you'll do a few more things to make it work well as a basemap. The basemap should show different things at different scales, so it is easy to read when you zoom in and out. For example, the city blocks layer is very detailed. It does not need to be visible when you zoom away from the city.
- In the Contents pane, right-click City blocks and choose Properties.
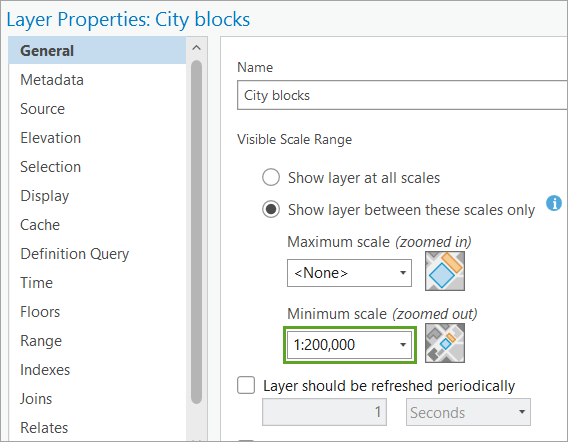
- On the General tab, under Visible Scale Range, ensure Show layer between these scales only is checked.
- Under Minimum scale (zoomed out), type 200,000 and press Enter.
- Click OK.
- Zoom out on the map.
The City blocks layer disappears. Next, you'll adjust the Municipalities layer.
- Zoom in to a municipality boundary line.
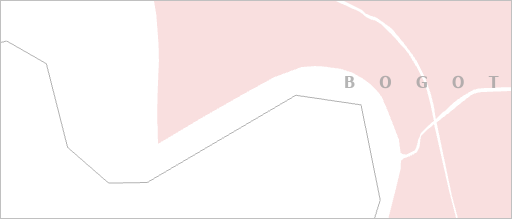
The gray lines are thin. You want them to appear thicker at large scales (zoomed in) and thinner at small scales (zoomed out).
- In the Contents pane, under Municipalities, click the symbol.
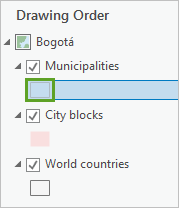
The Symbology pane appears.
- Click the Properties tab. If necessary, also click the Symbol tab.
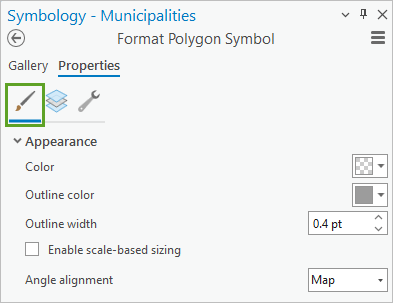
- Check the Enable scale-based sizing box.
A new slider control appears under Outline width. This slider allows you to define a range of sizes that are applied to the symbol based on the current map scale.
- On the slider, click the left scale stop. Drag it until the ToolTip text reads 1:500,000.
- For Outline width, type 0.2 and press Enter.
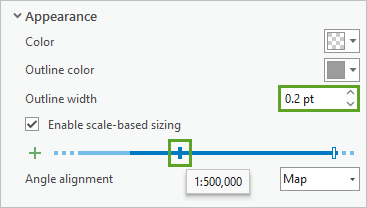
The boundary lines will now draw with a width of 0.2 points when the scale of the map is 1:500,000 or smaller. Next, you'll define the symbol size for larger scales.
- Drag the right scale stop to 1:50,000. For Outline width, type 3.
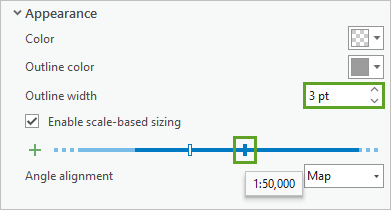
- At the bottom of the Symbology pane, click Auto Apply.
Now any changes you make will be automatically applied on the map.
- Zoom in and out on the map.
The borders appear thick when you are zoomed in and thin when you are zoomed out.
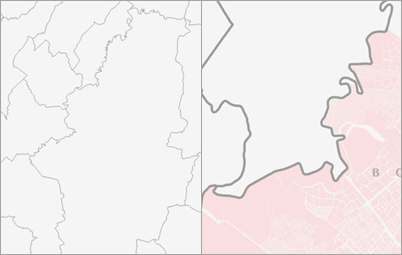
Note:
The Municipalities layer has already been configured with scale dependencies, so its labels, and eventually the layer itself, are not visible at smaller scales.
Your map now looks good at the different scales needed for your project. Next, you'll share it as vector tiles so it can be used as a basemap in ArcGIS Online.
- On the Quick Access Toolbar, click Save to save the project.

- If a window appears warning that the project was created using a previous version of ArcGIS Pro, click Yes.
Share the map as vector tiles
To use your map as a basemap, you'll share it as vector tiles. Tiles can include a lot of detailed data—such as the city blocks included in your map—and still load quickly. They do not allow interaction with the map; for example, you can't select features or view their attributes.
- On the ribbon, click the Share tab. In the Share As group, click Web Layer.

The Share As Web Layer pane appears.
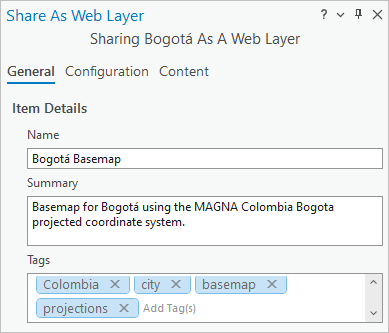
- For Name, type Bogotá Basemap, followed by your initials (for example, Bogotá Basemap_YN).
Note:
You cannot create two layers in an ArcGIS organization with the same name. Adding your initials to a layer name ensures that other people in your organization can also complete this tutorial. Once a layer has been created, you can rename it in the map to remove your initials, which will not affect the name of the underlying data layer.
- For Summary, type Basemap for Bogotá using the MAGNA Colombia Bogota projected coordinate system.
- For Tags, add projections.
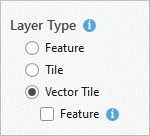
- For Layer Type, choose Vector Tile.
Vector tiles generate faster than raster tiles. If your map contained a raster layer, you would choose Tile instead.
- Uncheck Feature.
If you leave this box checked, you will publish a vector tile layer and a feature layer, which will take more time. The feature layer is not necessary for your basemap, so you'll leave the box unchecked.
- For Share with, check Everyone.
- Click Analyze.
The Messages tap appears. One error is listed: 00374 Unique numeric IDs are not assigned.
- Right-click the error and click Auto-Assign IDs Sequentially.
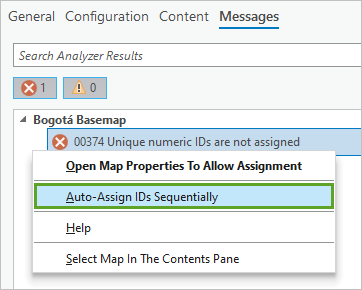
The red error symbol changes to a green checkmark to indicate that the error has been resolved.
- Click Publish.
The sharing process may take several minutes.

- When the web layer is successfully published, close ArcGIS Pro. It is not necessary to save changes.
You changed the coordinate system of a map to match the data provided by your client and you changed the visibility and the size of some of the map symbols to vary by scale. You also published a vector tile layer of your map, which you'll use to create a web map with the same projected coordinate system.
Use a custom basemap and rotation in ArcGIS Online
Your client asked for several web maps using a specific coordinate system. They also requested that all maps be rotated to place east at the top. This is a common rotation for maps of Bogotá and all of the other maps used by the utilities company have this orientation. Next, you'll use the vector tile layer you published in ArcGIS Pro to meet these requirements.
Use the vector tiles as a basemap
You'll use your new vector tile layer as the basemap for a webmap of Bogotá. This will ensure that the webmap uses the correct projected coordinate system.
- Open the Bogotá web map.
- At the top of the page, click Sign In and sign in to your ArcGIS account.
This is a web map that you have started building for your client. It shows routes and lines for the Transmilenio bus rapid transit system (Source: TRANSMILENIO S.A: www.transmilenio.gov.co)
Currently, it uses the Web Mercator projected coordinate system, inherited from its basemap. You'll update the map to use the new basemap.
- In the Layers pane, click Add.
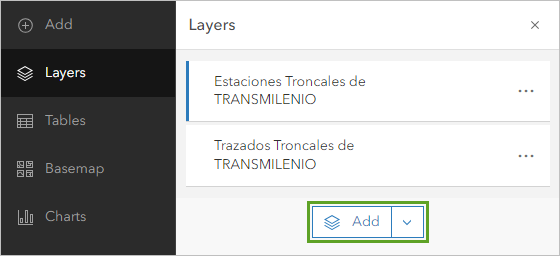
- Under My Content, the Bogotá Basemap tile layer that you shared earlier should be at the top of the list. If it is not, search for Bogota Basemap.
- Do not click the Add button on the Bogotá Basemap card . Instead, click the name of the tile layer.
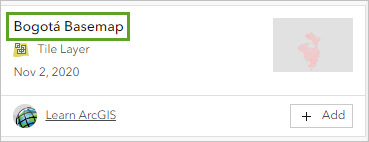
- Click Use as basemap.
- Close the Bogotá Basemap window.
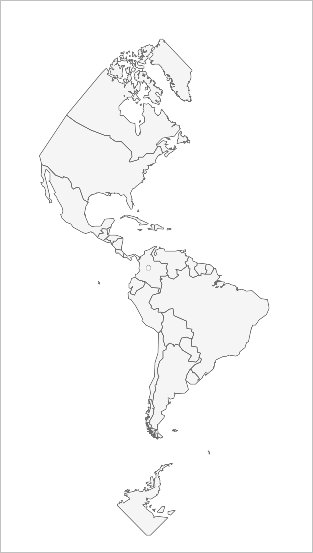
- Zoom out on the map until you can see all of South America.
You can tell by the shape and size of the continents that this map uses the new projected coordinate system.
Note:
Some projections cannot draw the entire world. The MAGNA Colombia Bogota projected coordinate system can only draw South America and parts of North America and Antarctica.
- On the Contents toolbar, click Layers to close the Layers pane.
- Also close the Properties pane.
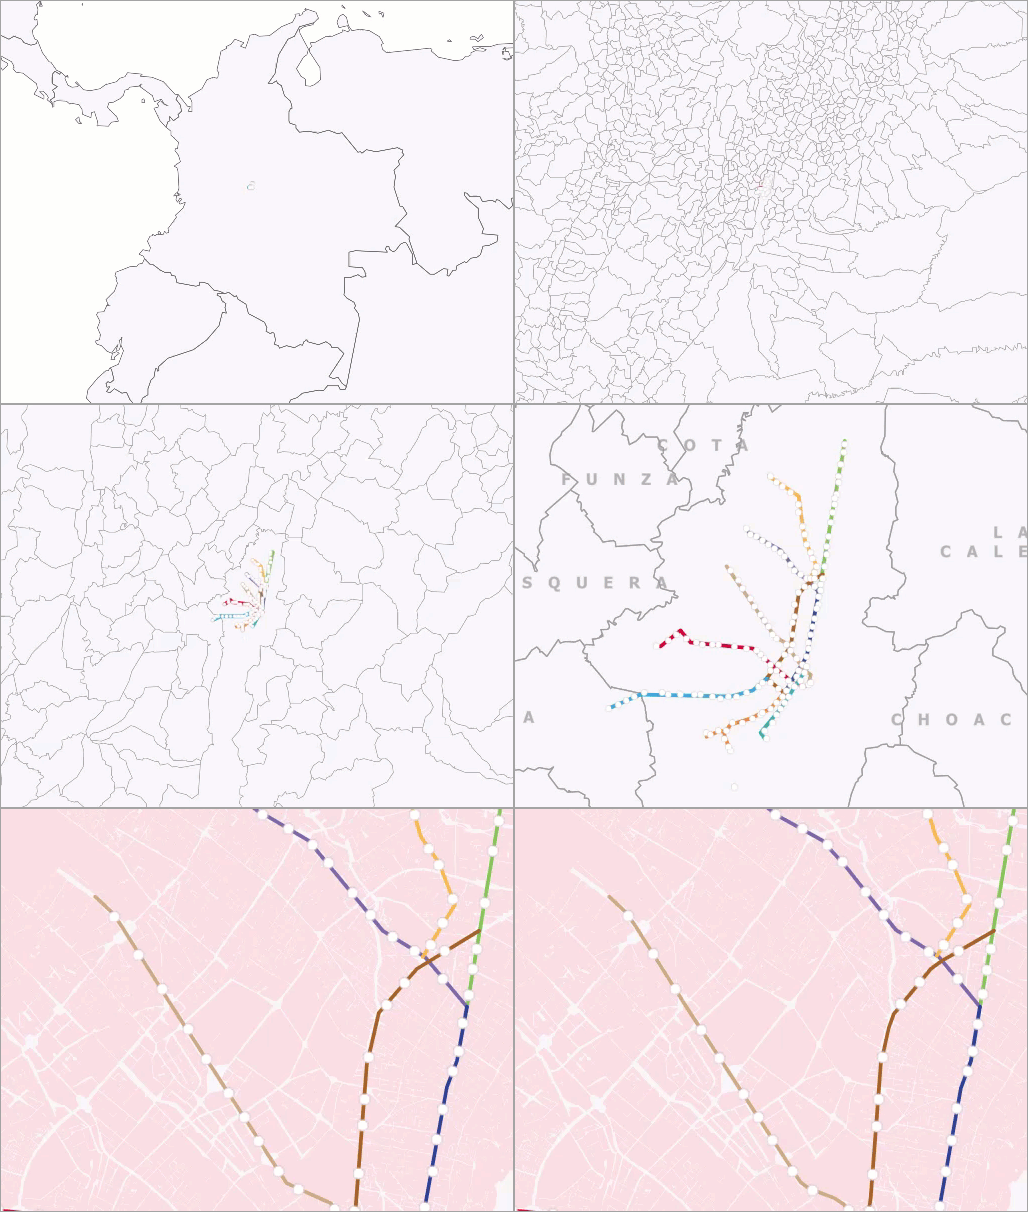
- Zoom in to Colombia and then to Bogotá.
As you get nearer, different layers become visible in your basemap.
Rotate the web map
This web map uses the required projected coordinate system. However, your client also requested that all maps for this project be rotated so east is at the top. This is a common orientation for maps of Bogotá.
- Click anywhere on the map to activate it.
- On the keyboard, press and hold the A key or D key.
The map rotates. In the bottom corner, a compass indicates orientation.
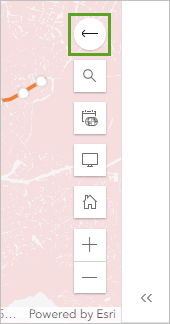
- Continue to rotate the map until the north arrow (the Reset map orientation button) points directly left.
Tip:
You can also click and hold the right button of the mouse to rotate the map. To return to the default orientation, click the Reset map orientation button or press the N key.
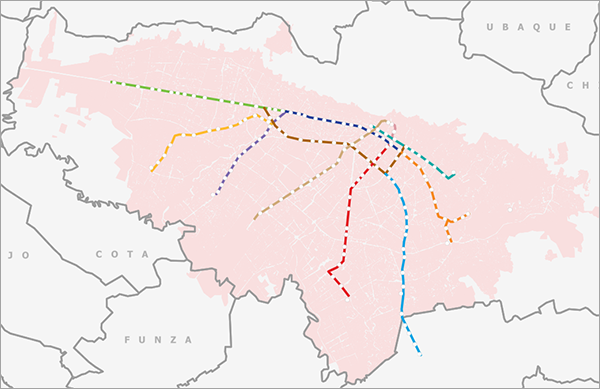
The map now meets all of your client's requirements.
- On the Contents toolbar, click Save and open, then click Save as.
- In the Save map window, click Save.
- On the Contents toolbar, click Share map and choose Everyone (public). Click Save.
In this tutorial, you created an equal area web map by changing its basemap. You also built a custom basemap in a projected coordinate system of your client's choice, published it as vector tiles, and used it to project a web map. Finally, you learned how to rotate a map.
It is often necessary to make maps with a coordinate system other than Web Mercator. You can build web maps using any projected coordinate system, including custom projected coordinate systems. Feature layers can be projected in web maps to any projection, but tiled layers cannot. For this reason, you must build a projected web map on top of a basemap using the same projection.
You can find more cartography tutorials on the Introduction to cartography page.

