Generate travel areas for charging stations
Add the data to a map
First, you'll create a map using data from ArcGIS Living Atlas of the World showing the locations of electric vehicle charging stations in Canada.
Note:
ArcGIS Living Atlas is a collection of geographic data from around the world. Its data comes from many sources, but it is curated by Esri to ensure accuracy and quality.
- Go to the Electric Charging Stations in Canada item details page in ArcGIS Online.
Before you continue, you'll sign in. This tutorial involves travel area analysis, which requires an ArcGIS organizational account.
- If necessary, on the ribbon, click Sign In.

- Sign in using your ArcGIS organizational account.
Note:
If you don't have an organizational account, see options for software access.
After you sign in, you return to the item details page. The page includes a description of the data and credits its original source, Natural Resources Canada (NRCan). It also contains a badge showing the data is from ArcGIS Living Atlas.
Next, you'll add the data to a map.
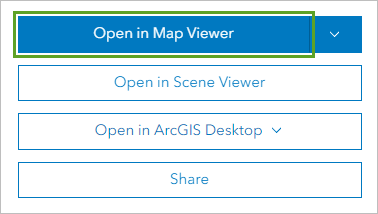
- Click Open in Map Viewer.
A new map is created, showing the electric vehicle charging stations as points across Canada.
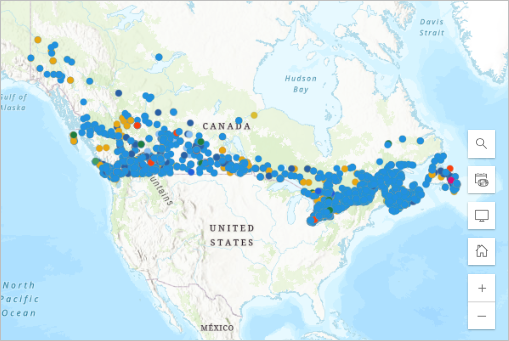
The color of each point corresponds to its type. The complete list of types is included in the Symbology section of the Properties pane. Some types refer to charging stations that aren't publicly available. Later, you'll filter out these charging stations so they don't affect your analysis.
- On the map, click any point.
A pop-up appears, showing more information about the charging station you clicked, including its street address, city, province, and phone number. Nonspatial information associated with GIS data, such as the information in this pop-up, is called attribute information.
- After you finish exploring the information, close the pop-up.
Next, you'll save the map.
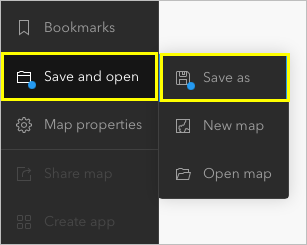
- On the Contents (dark) toolbar, click Save and open and choose Save as.
Tip:
If the Contents toolbar is collapsed by default, you can expand it by clicking the Expand button at the bottom of the toolbar. If it is expanded and you would prefer it to be collapsed, you can click the Collapse button. The example images will show the expanded toolbar, but you can proceed with whichever you prefer.
- In the Save map window, enter the following information:
- For Title, type Newfoundland Charging Station Travel Areas.
- For Tags, type Electric Vehicles, EVs, and Canada, pressing Enter between each tag.
- For Summary, type A map of electric vehicle charging station travel areas in Newfoundland, Canada.
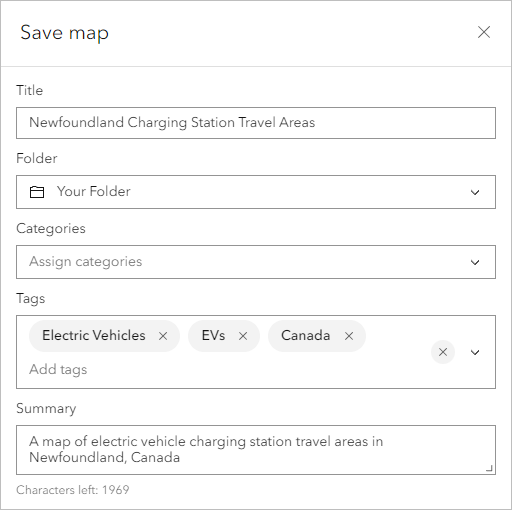
- Click Save.
Filter the data
The charging station data covers all of Canada, but you're only interested in the island of Newfoundland. You'll filter the dataset so it only shows charging stations in your area of interest. You'll also filter out charging stations that aren't available to the public.
- On the Settings (light) toolbar, click the Filter button.
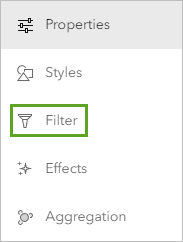
The Filter pane appears. Filters are based on expressions that use attribute information, like the information you saw in the pop-up.
When you looked at the pop-up earlier, it contained a State attribute that showed the abbreviation of the Canadian province or territory of the charging station. Newfoundland is in the province of Newfoundland and Labrador, which is abbreviated to NL. You'll use this information to create a filter.
- Click Add new.
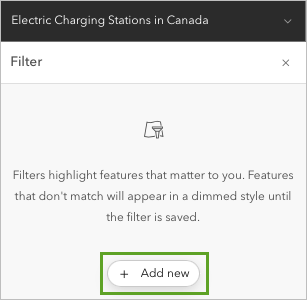
- Create the expression State is NL.
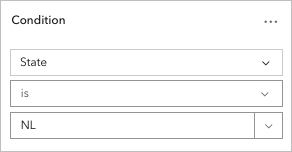
You'll add more expressions to further filter the data. First, you want to ensure only public charging stations are shown.
- Click Add new. Create the expression Access is Public.
You'll add one more expression to show only charging stations that include at least one direct current (DC) fast charger. This type of charge is best for efficient fast charging stops.
- Click Add new. Create the expression EV DC Fast Count is at least 1.
Your filter now includes three expressions.
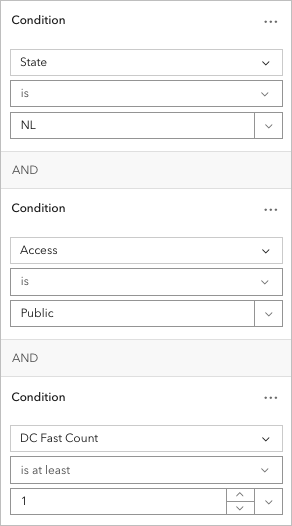
- At the bottom of the Filter pane, click Save.
The data is filtered on the map. Now, a much smaller number of charging stations appear, concentrated in eastern Canada.
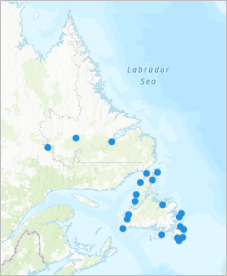
The province of Newfoundland and Labrador contains the island of Newfoundland and the continental region of Labrador. You're only interested in the island, so you'll navigate to it.
- On the map, pan and zoom until the map is centered on the island of Labrador. Ensure the charging stations in Labrador are not visible in the map extent.
Tip:
You can pan by dragging the map and zoom using the mouse scroll wheel. You can also zoom using the Zoom in and Zoom out buttons in the lower right corner of the map.
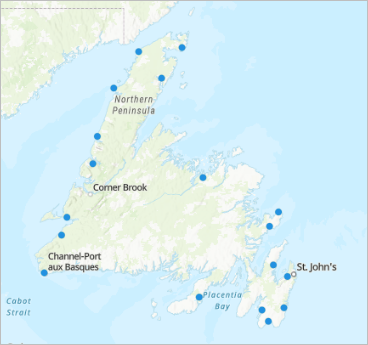
- On the Contents toolbar, click Save and open and choose Save to save the map.
Run travel area analysis
You're ready to perform travel area analysis on the filtered dataset. Your analysis will calculate the distance a standard electric vehicle can travel from each charging station before it needs to recharge. The result will show the range of electric vehicles on the island.
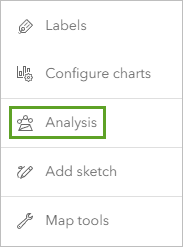
- On the Settings toolbar, click the Analysis button.
- In the Analysis pane, click the Tools tab.

- In the search bar, type Generate Travel Areas. In the list of results, click Generate Travel Areas.
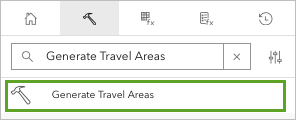
The tool appears in the pane. Analysis tools require you to set parameters that change how the tool is run. First, you'll choose the input layer, or the layer to be analyzed.
- For Input layer, click Layer. In the Select layer window, click Electric Charging Stations in Canada.
When the layer is chosen, a count of features is displayed. This number corresponds to the number of features displayed after the filter was applied.
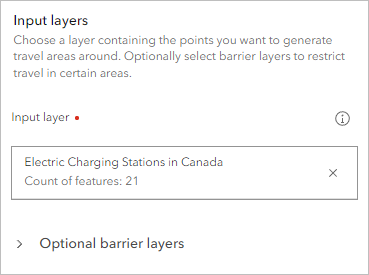
Next, you'll set parameters for the travel area based on the range of electric vehicles before they need to recharge. Different electric vehicles have different ranges; for this tutorial, you'll use a distance of 160 kilometers.
Note:
If you wanted to analyze the travel area of a specific type of electric vehicle, you could find its range and use that value instead of 160 kilometers.
- Under Analysis settings, for Travel mode, choose Driving Distance.
- For Cutoffs, type 160 and click Add. For Cutoff units, choose Kilometers.
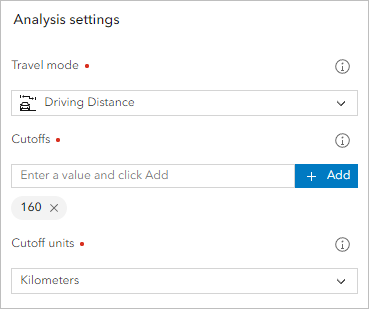
Note:
It's possible to add multiple cutoffs. For instance, if you wanted to know the range of two different types of electric vehicle, you could add one type's range as the first cutoff and the second type's range as the second cutoff.
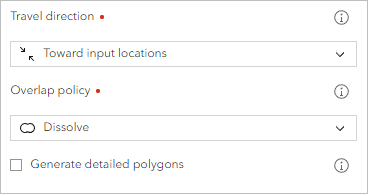
Electric vehicles must be able to reach a charging station to recharge, so you'll ensure the travel areas are determined by the distance to travel toward the charging stations, rather than away from them.
- For Travel direction, choose Toward input locations.
You'll also combine overlapping travel areas into one feature, because you only want to know the range where vehicles can reach any charging station, not a particular one.
- For Overlap policy, choose Dissolve.
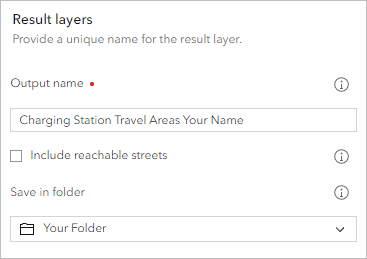
Next, you'll set the output layer's name.
- Under Result layers, for Output name, type Charging Station Travel Areas and add your name or initials to ensure the name is unique within your organization.
Note:
New items created by analysis operations must have unique names within your organization; otherwise, their URLs will conflict. Once the layer has been created, you can rename it in your map.
Lastly, you'll ensure the analysis is only run on the charging stations in Newfoundland, and not the ones in Labrador. By changing environment settings, you can make the analysis run only on features in the map extent, which currently only shows Newfoundland.
Note:
If your map displays charging stations outside of Newfoundland, pan and zoom until it shows only charging stations in Newfoundland.
- Expand Environment settings. For Processing extent, choose Display extent.
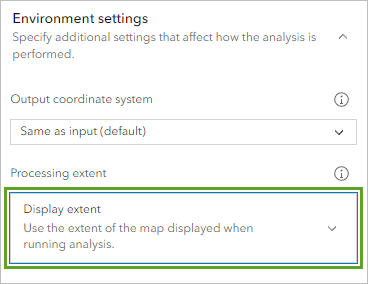
Before you run the analysis, you'll estimate the number of credits it will consume. Credits are the currency used across ArcGIS and are consumed during analysis. The number of credits consumed is usually based on the number of features being analyzed, which is why filtering the dataset and changing the environment settings were so important.
- Click Estimate credits.

The tool is estimated to consume about 12 credits, a relatively small number.
Note:
If you're not sure how many credits are allocated to your account, ask the administrator of your ArcGIS organization.
- Click Run.
The tool runs. When it finishes, the new layer with the travel areas is added to the map.
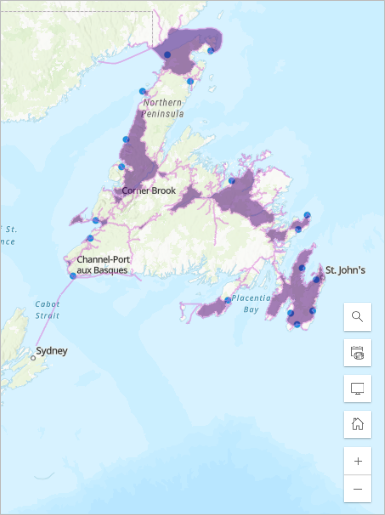
The travel areas cover most of the major populated areas on the island, including the capital of Newfoundland and Labrador, St. John's. However, some of the more rural areas lack coverage. Residents of the island can use the map to learn whether their area is covered by electric vehicle charging stations.
Note:
The data used in this tutorial including the number and location of charging stations, as well as the transportation network of roads and ferries, updates periodically. Your analysis results may differ from the example images.
- Save the map.
In this tutorial, you generated travel areas for electric vehicle charging stations in Newfoundland. First, you added data to a map. Then, you filtered the data to contain only features you wanted to analyze. Then, you ran an analysis tool and looked at the results.
The workflow in this tutorial can be run on any electric vehicle charging station dataset for any location in the world. The Generate Travel Areas tool is also useful for other scenarios, such as determining the service area of a business. The Electrify America presentation given at the 2023 Esri User Conference showcases more ways GIS can be used to assist adoption of electric vehicles.
You can find more tutorials in the tutorial gallery.

