Explore multidimensional soil data
First, you'll access an ArcGIS Pro project package from ArcGIS Online and download it to your computer. Once you have the project, you will explore a multidimensional voxel layer that contains geological data from the Netherlands.
Download the data
The project that you will use is on ArcGIS Online. You'll download it locally and work with it from your computer.
- Download the GeologicVoxels project package to a location on your computer you can easily remember.
- In the folder to which you downloaded the project package, double-click GeologicVoxels to open it in ArcGIS Pro. If prompted, sign in to your ArcGIS organizational account.
Note:
If you don't have access to ArcGIS Pro or an ArcGIS organizational account, see options for software access.
The scene displays a geological voxel layer and also contains a layer for buildings in Kamerik, a village in the Netherlands that you'll explore.
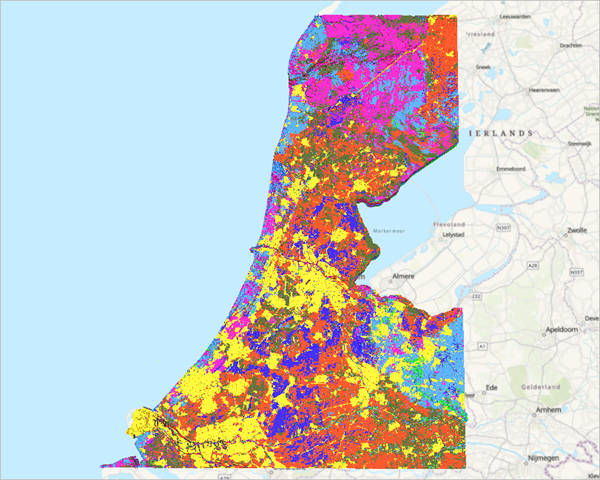
Note:
In this project, the voxel layer was added for you ahead of time. You can add your own multidimensional voxel layers, as a Net CDF file, from the ribbon, by going to the Map tab, in the Layer section, Add Data button, and by choosing Add Multidimensional Voxel Layer.
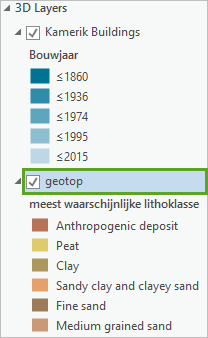
In the Contents pane, the layer is symbolized discretely using a variable named meest waarschijnlijke lithoklasse, or soil or rock class description.
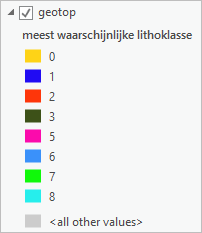
The layer is symbolized using unique values for each soil class, and one class for all other values.
Add descriptive symbology
The legend is not useful without a description of the color that is used for a category in the voxel layer. Next, you'll add descriptive information to the legend so you can tell which color is associated with each geological type. First, you'll visualize lithological categories with discrete voxel cubes, and see how the unique lithological classes are distributed in the region—most importantly, peat.
- In the Contents pane, right-click geotop and choose Symbology.
The Symbology pane appears, showing the layer's symbology. Currently, the labels for each category aren't meaningful. You'll provide meaningful labels by editing each row in the Label column.
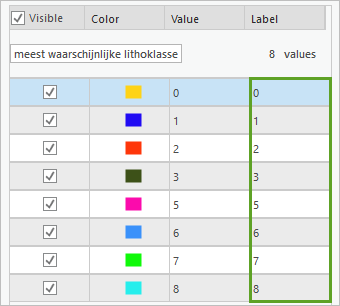
- In the Label column, double-click 0 in the first row to make it editable.
- Type Anthropogenic deposit and press Enter.

Note:
You can also double-click the next label to edit, rather than pressing Enter after each entry.
- For each remaining Value, edit the Label and replace the current value with the matching description:
- 0—Anthropogenic deposit
- 1—Peat
- 2—Clay
- 3—Sandy clay and clayey sand
- 5—Fine sand
- 6—Medium grained sand
- 7—Coarse sand
- 8—Gravel
The labels are updated in the Symbology and Contents panes.
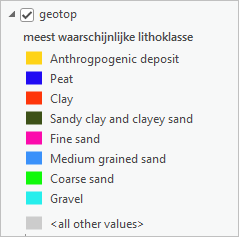
While the labels provide a better description than a numeric value, the colors do not accurately represent the lithology. Next, you'll modify the color scheme of the layer to be more geologically relevant.
- In the Symbology pane, for Color scheme, click the menu and check Show names and Show all.
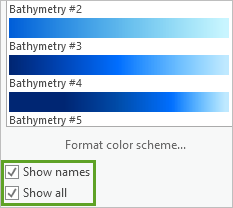
- Scroll down and click Terra Tones.
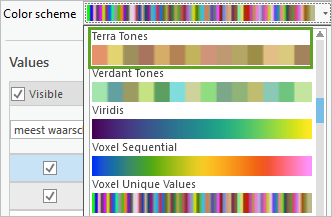
Once you assign the Terra Tones color scheme, the colors update in the Symbology pane.
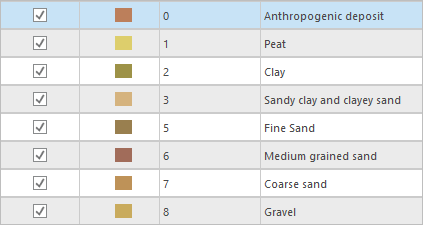
Note:
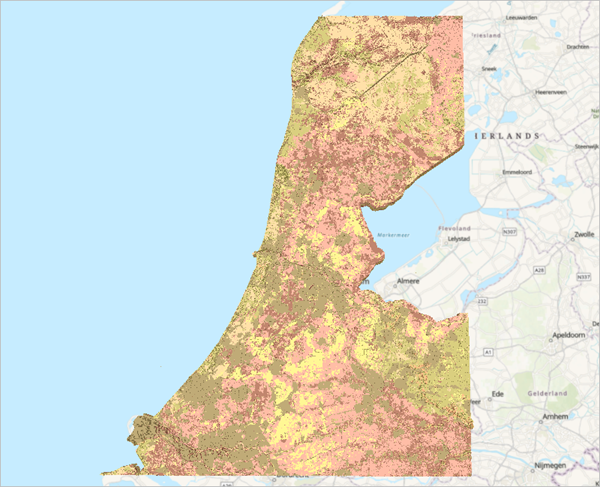
Colors from the color scheme are randomly assigned to each category. Your results may be different from the example images.
The Contents pane also displays the updated legend.
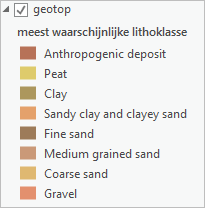
In the scene, the voxel layer symbology is also updated.
Note:
You can modify the symbology of the individual unique values for a greater contrast by clicking the color symbol in the Symbology pane.
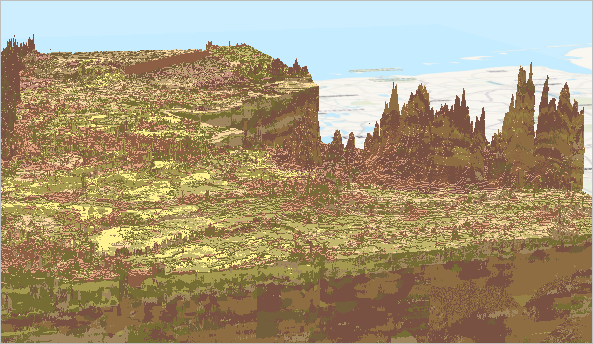
Next, you'll display the voxel layer using a vertical exaggeration. It's common to apply a vertical exaggeration to subsurface data to visualize it better. If a 3D voxel layer occupies a large horizontal area, it might appear flat if no vertical exaggeration is applied. Using vertical exaggeration pronounces the dimensionality of your voxel data and can enhance its appearance and visualization.
- In the Contents pane, click geotop to select the layer.
- On the ribbon, click the Voxel Layer tab. In the Elevation section, for Vertical Exaggeration, type 250 and press Enter.

- In the scene, click the wheel button on the mouse and move your pointer up and down to tilt the scene so you can visualize the vertical exaggeration.
Now that you have the lithology symbolized correctly, you'll explore individual types. Each of the lithological classes have a unique value that can be explored by turning their visibility on or off. You'll turn off all values and then explore some values independently.
- In the Symbology pane, under Values, uncheck Visible.
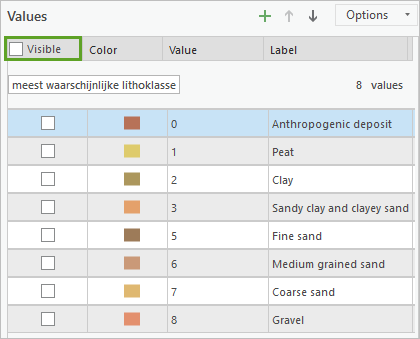
- In the Visible column, check the box for Peat to turn it on.

On the scene, only peat voxels display.
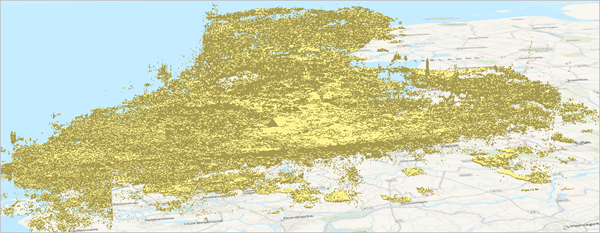
Next, you'll use a bookmark to navigate to an area to explore its soils.
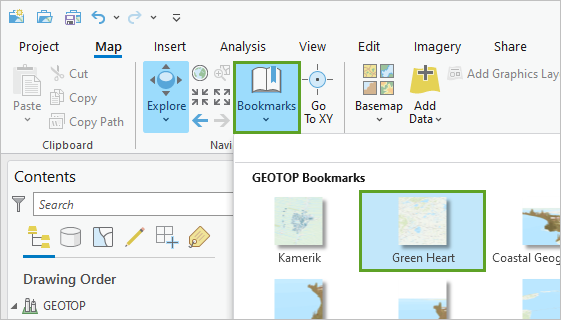
- Click the Map tab. In the Navigate section, click Bookmarks and choose Green Heart.
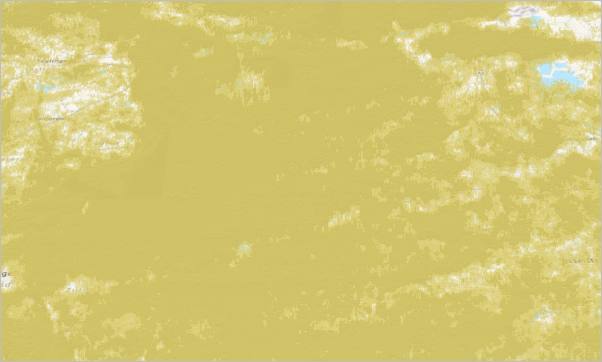
Green Heart, the rural area between the major cities of Amsterdam, The Hague, Rotterdam, and Utrecht, contains many brown peat voxel cubes at land surface. This peat is currently at risk of oxidization, so this area is prone to land subsidence. To visualize the concentration of the voxels, you'll set a transparency.
- In the Symbology pane, click the color patch for Peat.

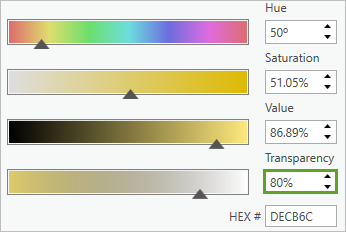
- Click Color Properties and in the Color Editor window, set the Transparency to 80 percent.
- Click OK.
There is a dense concentration of peat in the Green Heart area.
A signature example of a thick layer of peat underneath a building can be seen for the village of Kamerik. You'll zoom to a bookmark of the village and explore its underlying peat.
- In the Contents pane, turn off geotop.
- On the Map tab, in the Navigate section, click Bookmarks and choose Kamerik.
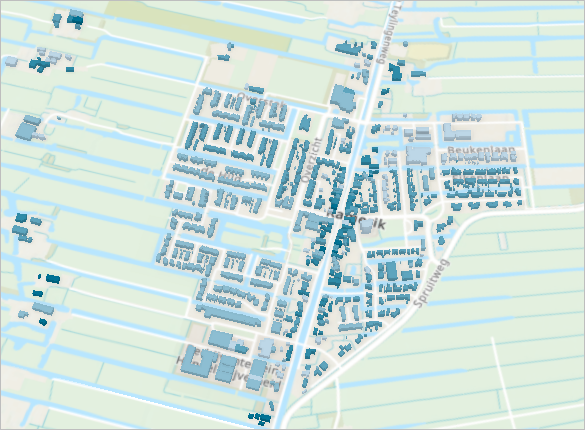
Peat is causing land subsidence and damage to the houses and the dairy farms around the village. The thin blue lines in the basemap are ditches used to drain the peat. Drainage is necessary to keep the meadows dry so cows from the dairy farms can walk around and eat from the grass. The water board/water authority keeps the area dry by lowering the phreatic groundwater level by pumping water out of the area through the network of ditches. As a result, the peat is exposed to air and oxidizes. Oxidizing means that the peat, which consists of dead plant material originally formed in swamps, is decomposed in CO2 and H2O. Oxidization of peat contributes considerably to the Dutch national CO2 emissions. In addition, the land surface is lowered. This means the groundwater table must be lowered even more, more peat is exposed to air, and the land subsides even farther, and so on.
- On the Quick Access Toolbar, click the Save button.
Next, you'll explore the underground lithology for the Kamerik area by creating an area of interest by slicing the voxels to view a subsection that exists under the village.
Analyze and animate voxel data
Viewing all the voxels at once provides great visualization for an entire area. To get a better idea of a specific area, you can slice the voxels to create an area of interest. The area of interest allows you to cut into the voxels to see exactly what is occurring in the area, whether it be above ground or underground. In this example, you can tell that peat is prevalent in Kamerik village, however, by viewing the entire voxel layer or just the peat, you cannot tell where the peat is below the ground. For example, if a developer wants to build in the Kamerik area, they would want to know about the peat because it can adversely affect the project.
Create an area of interest
You'll focus your analysis on Kamerik village so that you can visualize the lithology beneath it and determine whether it's suitable for development. To focus your analysis, you'll slice the voxel layer like a cake to eliminate all voxels around Kamerik, thus allowing you to see a clearer picture of the lithology for the area of interest. First, you'll turn off all basemaps and the ground surface so that these layers do not obstruct the voxels. You'll also offset the voxels so that they display directly under Kamerik village.
- If necessary, open your project in ArcGIS Pro.
- In the Contents pane, turn off World Topographic Map, World Hillshade, and WorldElevation3D/Terrain3D.
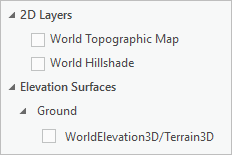
- In the Contents pane, turn on and click geotop, and on the ribbon, click the Voxel Layer tab.
You'll set a negative Offset to move the voxels below ground, rather than view it above ground. The voxel layer measures data up to approximately 50 meters, and you set a 250-meter Vertical Exaggeration value, so you'll set the Offset to ~50x250 = ~12,500 so that the top layer of the voxel appears on the basemap. The value varies slightly because of elevation variances in the area. For Kamerik, an offset of -12,080 makes it appear on the surface of the voxel layer.
- On the Voxel Layer tab, in the Elevation section, for Offset, type -12080 and press Enter.
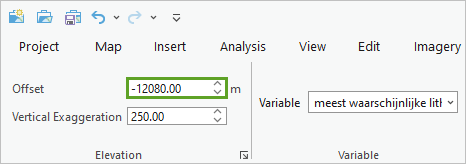
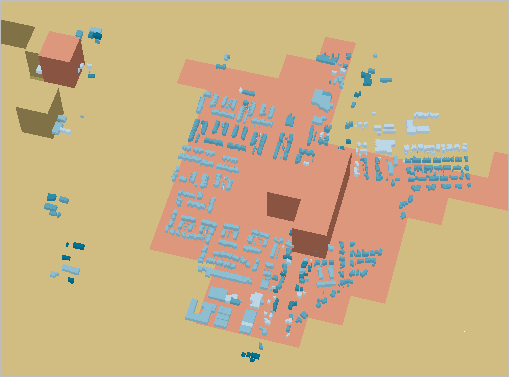
The Kamerik buildings now display close to the surface of the voxel layer, which will make creating the area of interest easier.
- In the Symbology pane, for Visible, click the check box to turn off all categories and click it again to turn on all categories.
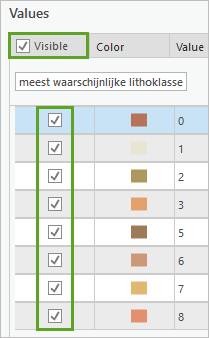
All soil categories display in the scene.
Note:
Depending on the tilt angle, the voxels may not be visible at ground level. Zoom out to see them appear.
- On the scene, zoom out so you are not so close to the voxel layer.
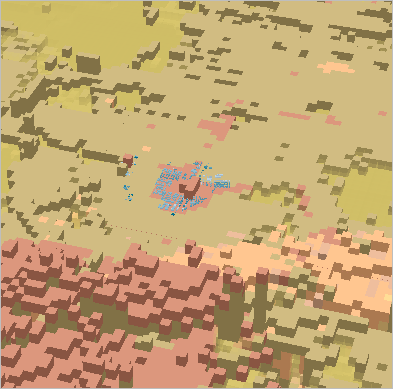
It is easier to slice the voxels when you are zoomed out from it. If you are too close to the voxel layer, it is like trying to cut a cake from within it. Zooming out provides more space to visualize the slices.
In the Contents pane, the voxel layer has multiple components, such as Volume, Surfaces, and Slices.
- In the Contents pane, right-click Slices and choose Create Slice.
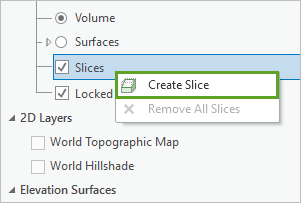
When you click Create Slice, the Slice and Section toolbar appears at the bottom of the scene.

From the Slice and Section toolbar, you can create slices, and modify them using the other tools. You'll create vertical slices to view the soil under Kamerik village. The Vertical Slice tool is active by default.
You'll create four slices that designate the perimeter of Kamerik village, using the buildings as a guide.
Note:
The screen shots are to be used as a reference to show you where to click for the slices. However, exactly where you click does not matter when you are creating a perimeter around the buildings.
- On the scene, click a location to the west of the buildings to start the slice and click a second location in the southwest of the buildings to complete the slice.
Note:
Be sure to click within the voxels and not in the white space.
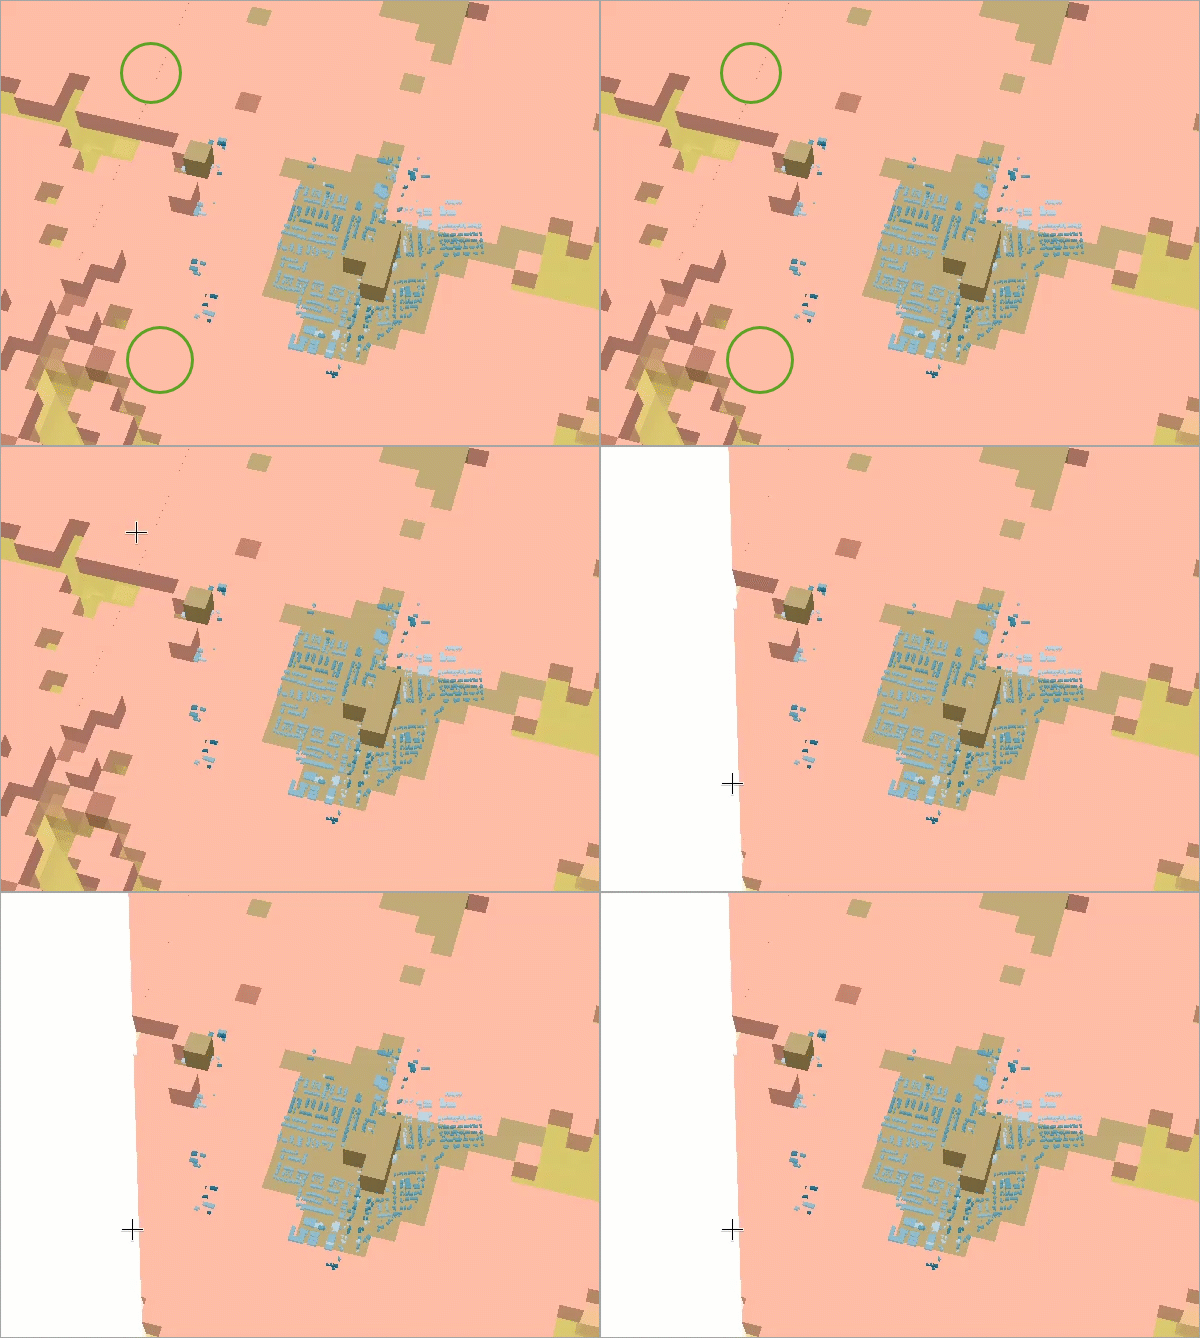
- In the Contents pane, right-click Slices and choose Create Slice.
- On the scene, click the voxels on the other side of Kamerik village.
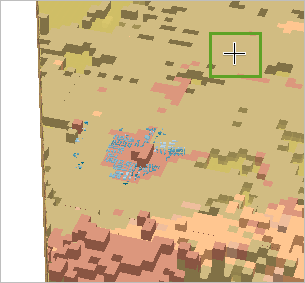
- Click a second time to complete the slice.
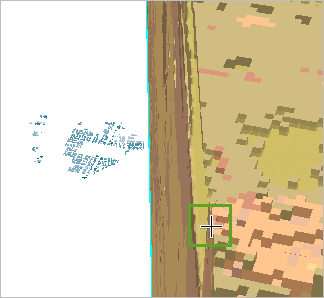
The voxels are on the other side of Kamerik. You want to view the voxels beneath Kamerik, so you'll flip it.
- From the Slice and Section toolbar, click the Flip button.

Now the visible voxels are under Kamerik village.
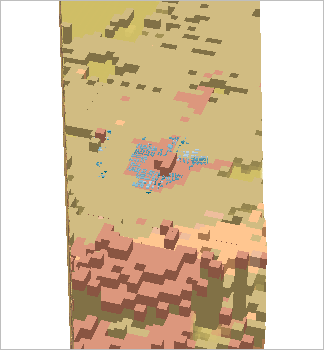
Next, you'll create two more slices to clip out only the area under Kamerik village.
- In the Contents pane, right-click Slices and choose Create Slice.
- On the scene, create a slice to the north of Kamerik village by clicking one time within the voxels on each side.
- From the Slice and Section toolbar, click Flip.
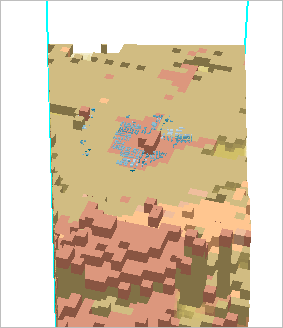
- In the Contents pane, right-click Slices and choose Create Slice.
- Create another slice for the south side of Kamerik village.
- Click anywhere in the scene to deselect the slices.
- On the ribbon, on the Map tab, click the Explore tool and tilt the scene to view the voxels beneath Kamerik village.
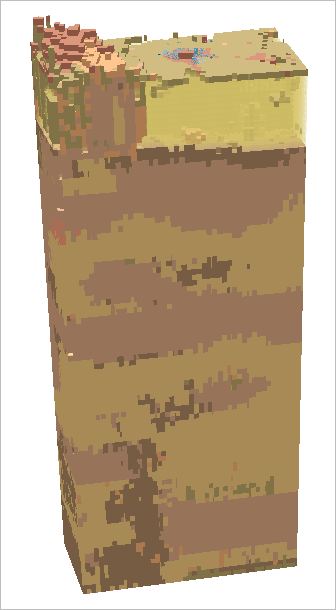
After creating the area of interest, you can see the entire lithology under Kamerik village. You can turn off all categories and view them separately to see the prevalence of each lithological class. At a glance, there is a dense concentration of peat near the surface.
- In the Contents pane, right-click geotop and choose Symbology.
- Uncheck Visible and turn on Peat.
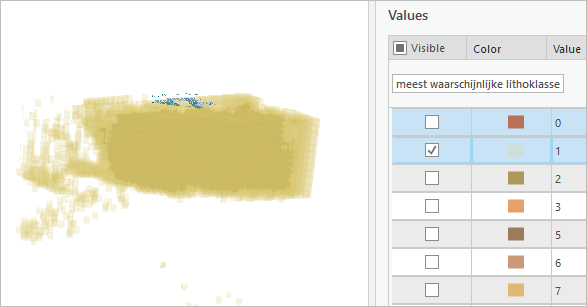
There is a dense concentration of peat at the surface, which has caused the land in Kamerik to subside by up to four meters in the past 1,000 years. Developers and city planners in the area must prioritize this actively.
- Turn on and off the various lithology categories to view their voxels. When finished, make all categories visible.
- In the Contents pane, turn off Slices.
You've created an area of interest for Kamerik village by slicing the voxel layer to explore the soil concentrations beneath the village. Slicing the voxel layer and viewing the area of interest gives you more insight into a specific area to help you make data-driven decisions.
Create an animation of the coastal lithology
The main line of defense against the rising sea level is the range of sandy beaches and coastal dunes. Next, you'll explore the unique coastal geology of the area. You'll view bookmarks for several places of interest and explore the lithology along the coast. The bookmarks were set up in the project for use in the animation that you are about to create.
- In the Contents pane, turn on World Topographic Map, World Hillshade, and WorldElevation3D/Terrain3D.
- On the Map tab, in the Navigate section, click Bookmarks and choose Coastal Geography - 1.
The scene zooms to the coast.
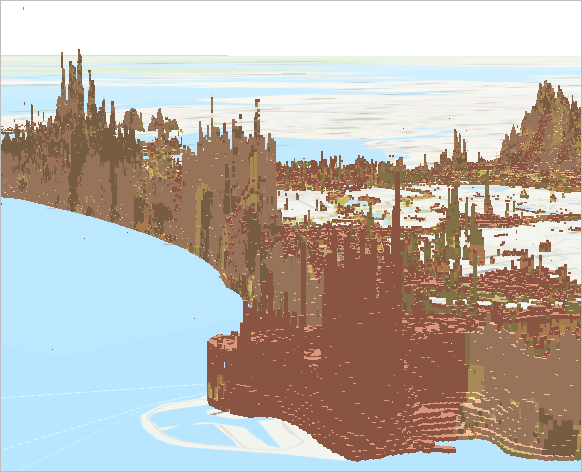
The coastal dunes display as mountains of medium-grained sand voxels. In areas where the dunes are small, low, or even absent, the coastline is being reinforced by dikes. You'll explore these areas using bookmarks.
- On the Map tab, in the Navigate section, click Bookmarks.
- One by one, click each of the Coastal Geography bookmarks to view them.
Note:
You must click the Bookmarks button each time you want to view a different bookmark.
- On the Map tab, in the Navigate section, click Bookmarks and choose Zuiderzee Works.
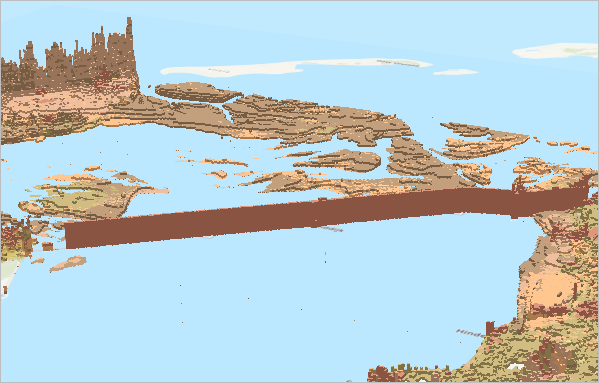
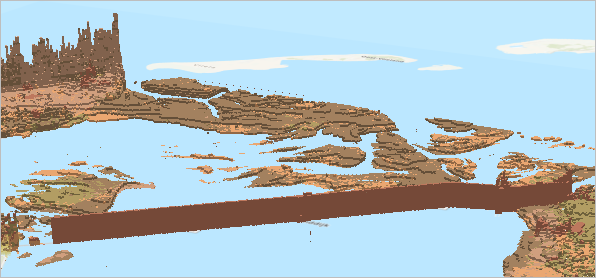
The last bookmark is the Zuiderzee Works area, declared as one of the seven wonders of the modern world. This area was a series of dams, land reclamation, and water drainage projects. At first, some dams or dikes were built to separate the Zuiderzee (South Sea) from the North Sea. The biggest dam was the Afsluitdijk (closure dike). As a result, the South Sea was completely cut off and became a lake called the IJsselmeer.
- In the Contents pane, turn off the geotop layer.
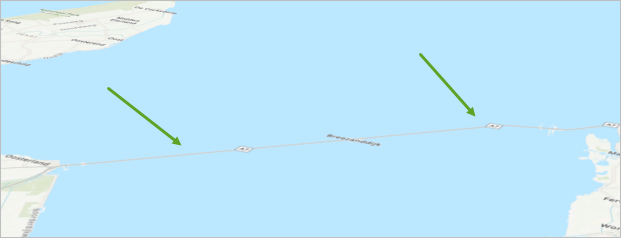
Once the voxel layer is off, you can see the Afsluitdijk (shut-off dike) as a thin strip on the basemap.
- In the Contents pane, turn the geotop layer on and click it to select it.
You'll adjust the lighting of the voxel layer to achieve better contrast. Values are suggested, but you can adjust them to what you think looks good.
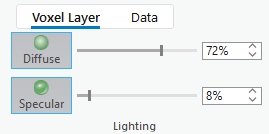
- On the Voxel Layer tab, in the Lighting group, set Diffuse to 72 percent and Specular to 8 percent.
The geotop layer updates on the scene.
Next, you'll create more bookmarks for your animation.
- Pan along the coastline and locate other visually appealing areas. From the Map tab, in the Navigate section, click Bookmarks and choose New Bookmark.
- Name each bookmark accordingly, based on what is being shown.
Next, you'll create the animation.
- On the View tab, in the Animation group, click Add.

The Animation tab becomes visible on the ribbon and the Animation Timeline pane appears.
- On the Animation tab, in the Create section, click Import and choose Bookmarks to Fly-Through.
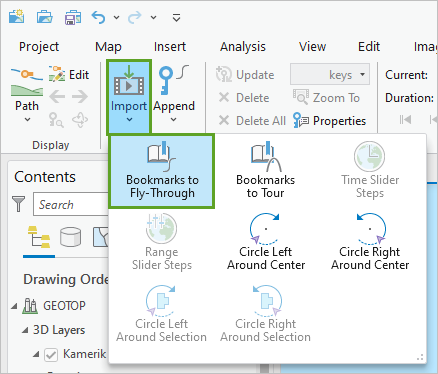
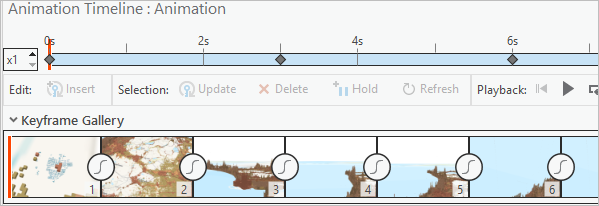
All the bookmarks are added as frames in the animation timeline.
Note:
Your bookmarks may be different based on where you zoomed to and how many you added.
- In the Animation Timeline pane, click Play.

The animation flies through the bookmarks in the order in which they appear in the Bookmarks pane.

Note:
You can change the order of bookmarks in the Bookmarks pane by dragging them up or down in the list. You can also change the order in the Animation Timeline, Keyframe Gallery, by dragging the keyframes to a different place in the animation.
At the end of the animation, you can choose to add a circle around the animation to focus on an area of interest and show it from different views.
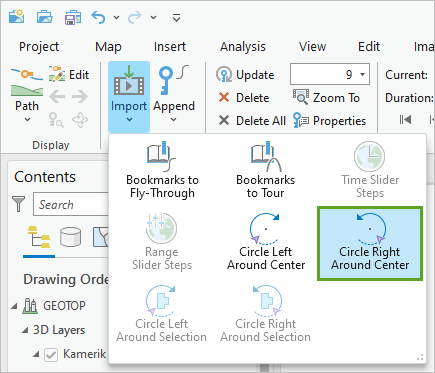
- On the Animation tab, in the Create section, click Import and choose Circle Right Around Center.
- On the Animation Timeline, click Play.
When the animation reaches the final keyframe, it circles to the right around it to provide views from every direction. Next, you'll export your animation as a movie.
- On the Animation tab, in the Export section, click Movie.

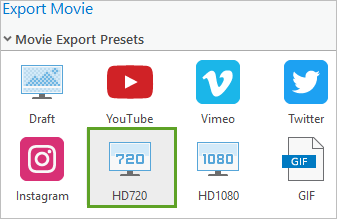
- In the Export Movie pane, for Movie Export Presets, click HD720.
Note:
A higher resolution will take longer to complete, but you can choose a smaller resolution to expedite the process. You can also customize the export options for a faster or higher-quality export.
- For File Name, accept the default path of ..\Documents\ArcGIS\Media to store the video there.
- Click Export.
Note:
It may take several minutes for the video to export.
- When the movie has finished exporting, browse to the folder where you stored it and watch it.
You can now share this video. When many stakeholders are involved, animations can help you tell a story with a map or a scene and then export it as a video to share. This makes your analysis accessible.
You've worked with complex subsurface data that has been interpreted into discrete categorical values that you visualized and analyzed using a voxel layer. Through the process of visualizing the lithological classes in the Netherlands, you can now estimate the importance of peat in the Netherlands' geology, as it has shaped much of the country’s history, policy, and environmental reality. By using the Netherlands' geological categories visualized with voxel layer functionalities, you created slices, areas of interest, and exported various views of the voxel layer as a movie for effective storytelling.
You can find more tutorials in the tutorial gallery.

