Import ground control points and add image links
To begin, you'll download and open an existing Drone2Map project and gain familiarity with its components. Then you'll import ground control points (GCPs) and check points (CPs) using two methods. You will add image links to one of the points.
Set up the project
First you will download the imagery of Rancho Del Mar and open it in ArcGIS Drone2Map. You'll review the images that are available.
Note:
The data used in this tutorial is 1.95 GB and will take several minutes to download.
- Download RanchoDelMar.zip.
- Locate the downloaded file and unzip it to drive C, so the folder path is C:\RanchoDelMar.
Caution:
Some data connections will be broken if you unzip the file to a location other than drive C.

- Open the extracted RanchoDelMar folder. Double-click RanchoDelMar.d2mx to open the project in ArcGIS Drone2Map. If prompted, sign in to your ArcGIS account.
Note:
If you don't have an organizational account, see options for software access.
The project appears in ArcGIS Drone2Map. The Contents pane lists three layers: Image Centers, Flight Lines, and Control. The Control layer is currently empty. Later, you will import GCPs into this layer.

- On the map, click one of the blue Image Centers points.
The Image Viewer window appears, showing a high resolution image for that area.

There are 174 images in the project.
- Close the Image Viewer window.
- Right-click anywhere on the map and click Clear.

Next, you'll examine where the data for the project is stored.
- Below the Manage pane, click the Catalog tab.

- In the Catalog pane, on the Project tab, expand Folders and expand RanchoDelMar.
ArcGIS Drone2Map organizes project components into various subfolders.
- Expand RanchoDelMar.gdb.

The project's geodatabase contains the three feature classes listed in the Contents pane. Any new data that you import into the project will also be stored here.
- Expand the Images folder.
The images referenced by the Image Centers layer are stored here.
ArcGIS Drone2Map uses geolocated images and creates tie points between neighboring images so that they can be merged together to form imagery products. The images in this project have not yet been merged together.
While GPS data from drones is accurate enough for most general analysis and product generation, for this project, you must be confident that you have the highest accuracy possible. To ensure this accuracy, you'll incorporate ground control points when you stitch the images into an image collection.
Note:
Some drones that use real-time kinematic (RTK) correction to apply high accuracy correction to GPS information on the fly. Even with these drones, it is still useful to collect GCPs to be used as CPs that help validate your drone's accuracy.
Import ground control points from a .csv file
GCPs are high accuracy points captured on the ground either before or after a flight that are used to adjust output products created in ArcGIS Drone2Map. These points are typically marked on the ground so they are visible in the imagery and can be used to create geolocation links between images. It is recommended that you use between five and ten GCPs well dispersed across the image area.
You will import a ground control point from a .csv file.
- On the ribbon, click the Home tab. In the Control group, click the bottom half of the Control button and click Import Control.

- In the Import Control window, browse to the RanchoDelMar folder. Select Rancho_Del_Mar_GCP_EPSG32611.csv and click OK.

The Import Control window updates. In the Control Coordinate System section, the Current XY coordinate system was automatically defined as WGS 1984 UTM Zone 11N and the Current Z vertical coordinate system was automatically defined as EGM96 height. The data in the .csv file is defined using the same coordinate systems.

- Leave the Control Photos section empty.
There are no control photos for this GCP.
- In the Control Field Information section, ensure that the location fields were matched with the correct fields from the .csv file:
- Lat [Y]—Set to Latitude.
- Lon [X]—Set to Longitude.
- Elevation [Z]—Set to Elevation.
- Label—Set to Label.
- For Accuracy Horizontal. Choose H_Accuracy. For Accuracy Vertical, choose V_Accuracy.

- Click OK to import the GCP.
In the Contents pane, the Control layer disappears temporarily and reappears when the import is complete. A green cross symbol appears on the map.

In the Control Manager pane, the new GCP appears as the first row in a table. The table row has an orange warning symbol to indicate that the GCP is not yet linked to any images.

Next, you'll create links between the GCP and the images that overlap it.
Add image links
In ArcGIS Drone2Map, you can link ground control manually or automatically. However, if you choose the automatic method, you still must create a few image links manually before the software can determine where other links may be. If you have a small set of GCPs, it is recommended that you manually link all of the images to ensure the greatest accuracy. You will manually link the GCP from the .csv file.
- In the Contents pane, turn off the Image Centers and Flight Lines layers.

- In the Control Manager pane, click the GCP 1 row to select it.
- Click the Show image links editor button.

The Image Links window appears. On the left, all of the project's images are listed. Those closest to the GCP are listed first.
- In the list, click the first image to ensure it is the one displayed in the viewer.

- In the viewer, zoom to the red X marked on the sidewalk, near the center of the image.

- Zoom in and click the center of the X to place a link marker.

The link marker is added but it is difficult to see because its default color is red. You'll change the link marker's color to yellow.
- Close the Image Links window.
- On the ribbon, click Project.
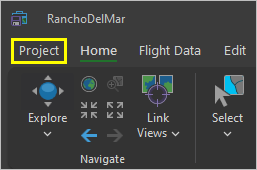
- Click Settings.

The Settings window appears.
- Click Control.
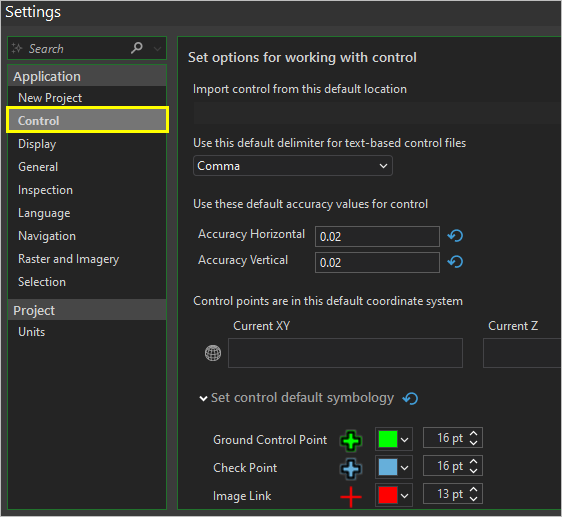
- Under Set control default symbology, for Image Link change the color to Solar Yellow.
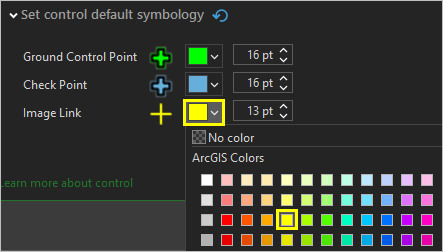
- Click OK.
Now you'll reopen the Image Links window.
- In the Control Manager pane, click the Show image links editor button.
The Image Links window appears and the link marker is yellow and visible.
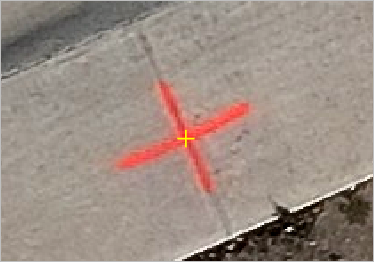
In the list, a green check mark appears next to the first image, to indicate that it has been linked.
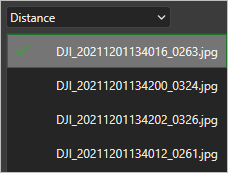
- In the list, click the next image.
The next image appears in the viewer. It has a different orientation than the last image, but the same red X is visible on the sidewalk.
- Zoom to the red X and click its center to add another image link.
- Add image links to the next three images, each time aligning them with the center of the red X.
Note:
Optionally, continue through the list of images to find more images containing the red X and add an image link to each. The images that are most likely to contain the red X are all listed near the top.
- Click OK.
In the Control Manager pane, the warning symbol next to GCP 1 is replaced with a green check mark to indicate that the GCP now has a sufficient number of image links.

- Right-click anywhere on the map and click Clear to deselect GCP 1.
Import ground control points and check points
Next, you'll import eight more GCPs. The image links have already been created for these GCPs in another Drone2Map project, so instead of importing a .csv file, you'll import a .zip file exported from the previous project.
Note:
You will use this method in this tutorial to save time. Generally, you would only want to use this method if your flights over the same location use GCP markers that are static features. If you are using temporarily placed targets, the locations of the targets will be very hard to match exactly when placing them for additional flights.
- At the top of the Control Manager pane, click the Import Control button.

- In the Import Control window, browse to the RanchoDelMar folder.
- Click GCP.zip.

- Click OK.
In the Import Control window, the Ground Control Point table populates with eight rows.

- In the table, click the row with a Label value of 2.
The Image Links list next to the table updates to list six images that are linked to this GCP.
- Click each row of the table to see how many images links will be imported with each point.
- Click OK to import the ground control points.
In the Control Manager pane, the new points appear in the table. All of them have green check marks.

The Type column shows that five of the points are GCPs and four are check points CPs. GCPs and CPs are collected in the same manner, but they are used for different purposes. GCPs are used to process imagery products and improve accuracy, while CPs are not included in processing. Instead, they are used to independently assess the accuracy of the model after processing.
In this module, you opened an existing Drone2Map project, added a GCP, and linked images to it. Then, you imported additional GCPs.
Adjust the imagery and evaluate its accuracy
Next, you will process the 174 images in your project to generate an image collection. Processing will stitch the images together using aerial triangulation and bundle block adjustment. After processing, you'll review the results of the adjustment and assess the accuracy of the GCPs. You'll reposition some of the image links and rerun the adjustment to improve overall accuracy.
Run the block adjustment
Next, you'll process the imagery to create an image collection.
- Below the Control Manager pane, click the Manage tab to switch to the Manage pane.
- Under 2D Products, ensure that Image Collection is the only item checked.

Later, you plan to create an True Ortho and digital terrain model, but for now, you will only create an image collection to save time in assessing ground control accuracy. Once the accuracy values are satisfactory, you can generate the output products that you need.
- On the ribbon, click the Home tab. In the Processing group, click Start.

- In the Processing group, click Log.
The Processing Log view appears, showing the progress of the processing steps.

Processing will take a long time to run, so you should move to another task and return to this tutorial later.
Evaluate accuracy
After the adjustment process has completed, you'll review the accuracy of the GCPs and their individual image links. You'll assess the accuracy values for each GCP (dX and dY) and the reprojection errors for the image links. The closer these values are to zero, the more accurate the alignment.
- Check the Processing Log view to confirm that adjustment processing is complete.
When the process is complete, the last message in the log will be Processing completed successfully. The progress bar at the bottom of the Manage pane will remain at 100 percent.

First, you'll review the Catalog pane to view the results of the adjustment process.
- On the ribbon, on the Home tab, in the Layers group, click Catalog.

- In the Catalog pane, if necessary, expand Folders. Expand the RanchoDelMar folder and RanchoDelMar.gdb.
There are four new items present in the geodatabase: the new image collection and its associated data.

Next, you'll view the accuracy values for each GCP.
- On the ribbon, on the Home tab, in the Control group, click Control Manager to reopen the Control Manager pane.
- Drag the side of the pane to make it wider until you can read all of the columns in the table.

The dX, dY, and dZ columns are populated. These are measurements of each control point's accuracy after adjustment. A value that is close to zero means that the point had to shift very little and will retain most of its initial accuracy.
Note:
The values in your table will be slightly different than the ones shown in the image above, due to how you placed the image links.
- Review the d values in the table.
GCP 5 has larger accuracy values than the other control points.
These values are related to the placement of image links. If one or more image links are placed incorrectly, you will see a significant deviation in these values. It is likely that an image link for GCP 5 was incorrectly placed. You'll review the image links to fix this issue.
- In the Control Manager pane, click the Show image links editor button.
- In the Image Links window, for Control Point, choose 5.

Before, the image links were sorted by distance. Now they are sorted by Reprojection.
Reprojection errors are computed for each image link. This value represents the distance between the initial point and the adjusted point, measured in pixels. All the image links will shift slightly, but a reprojection error greater than 1 is considered high. Images with higher reprojection errors are listed first.
- In the image list, click the first image to ensure it is the one shown in the viewer.
Above the viewer, the Reprojection Error value for the selected image link is listed.

In the image above, the value is 3.106. The Reprojection Error values will differ slightly in your project.
- In the viewer, zoom to the image link.
The yellow image link marker is offset from the center of the red X.

- In the viewer, click the center of the red X to reposition the image link.
Above the viewer, the Reprojection Error disappears.
- Click the next image in the list.
It also has a Reprojection Error value greater than 1.
- Reposition the image link for the second image.
In the image list, five of the images have green check marks to indicate that they have image links. Most of the reprojection errors for these image links are close to 1 so you will reposition them all.
- Click each of the linked images in turn and reposition its image link.
- Click OK to close the Image Links window.
Reviewing image links with high reprojection errors helps provide you with quality control to achieve the best products possible. Anytime you incorporate ground control into your project, it is recommended that you review the image links after the adjustment has been carried out.
Next, you will rerun the block adjustment process using the modified image links. This will not take as long as the initial process and will provide you with updated accuracy values.
Reprocess and re-evaluate
You'll process the imagery again to see if the changes you made to the image links for GCP 5 have helped with GCP accuracy. It is normal to run through the adjustment process multiple times before you obtain accuracy values that are suitable for your imagery products.
- On the ribbon, on the Home tab, in the Processing group, click Start.
- If the Processing Log view is not already open, click Log.
- When processing is complete, close the Processing Log view and open the Control Manager pane.
- Review the new dX, dY, and dZ values.

The values have changed. All values should be less than 0.1 If they are not, the image links for that control point may be too far from the center of the X.
Note:
The absolute accuracy of each GCP has not changed. These values are recorded in the horizontal (H_Accuracy) and vertical (V_Accuracy) accuracy fields included with the GCP imports. Rather, the accuracy of each adjusted GCP has changed. The process followed in this tutorial is intended to place each adjusted GCP location as close as possible to the initial imported location. These steps will not make the original data more accurate, but they will improve the overall accuracy of any imagery products created from it.
- On the ribbon, on the Home tab, in the Processing group, click Report.

The Processing Report window appears.
- Scroll to the Geolocation Details section.
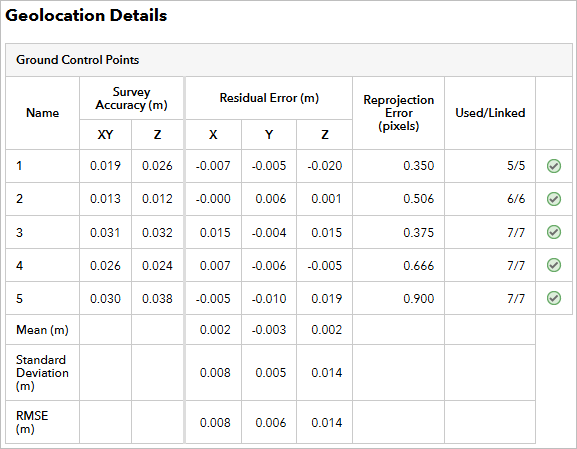
Your values may differ from the values in the image above.
The Reprojection Error value for each GCP and CP is less than 1. The accuracy values (dX, dY, and dZ) are all less than 0.1. For your purposes, these are acceptable accuracy values, so you are now ready to generate accurate imagery products.
Note:
If you still see high accuracy values for any GCP, review and reposition its image links again. You can also remove a GCP.
- Close the Processing Report window.
- Above the toolbar, click the Save Project button.

Having well aligned and accurate imagery when doing disaster planning is key to allocating the proper number of resources or predicting potential areas of concern. Since you have accurately adjusted the imagery to your GCPs as best as possible, it can now be processed into elevation models to evaluate risk of landslide or an orthomosaic to review the area for potential hazards or unsafe structures.
In this tutorial, you imported GCPs, added image links, processed imagery, assessed the accuracy of the GCPs, and modified image links. This process allows you to create imagery products with greater accuracy. Optionally, continue to experiment with the methods that you learned in this tutorial on the dataset that is provided and test the generation 2D or 3D products.
You can find more tutorials in the tutorial gallery.

