Collect fountain data
Before you can analyze the equitable distribution of drinking fountains across Berkeley, you need to know where they are and whether they are clean and functioning. You'll acquire this information through ArcGIS Field Maps, an ArcGIS app that allows users to capture data in the field using a smartphone or other mobile device.
Create a layer
First, you'll create the feature layer that will be used to add fountains in ArcGIS Field Maps. You'll create this layer on ArcGIS Online (or ArcGIS Enterprise).
- Sign in to your ArcGIS organizational account or into ArcGIS Enterprise using a named user account.
Note:
If you don't have an organizational account, see options for software access.
- On the ribbon, click Content.

- On the Content page, click New item.

- In the New item window, click Feature layer.
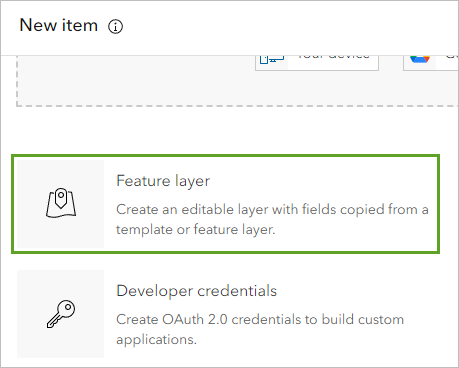
The Create a feature layer window appears.
- Under Select an option to create a feature layer, confirm that Define your own layer is selected.
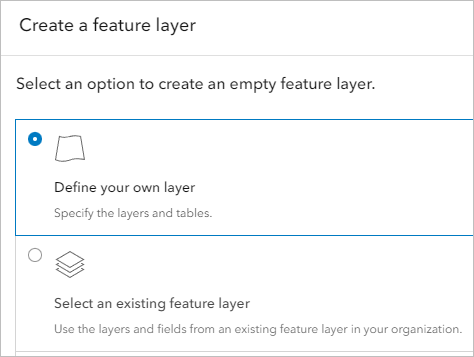
- Click Next.
You're prompted to specify the name and type of the feature layer. You can create a point, line, or polygon feature layer. Drinking fountains are best displayed as points.
- Under Specify name and type, for the name, type Berkeley Fountains followed by your name or initials (for example Fountains Your Name). For the type, confirm that Point layer is selected.
Note:
You cannot create two layers in an ArcGIS organization with the same name. Adding your initials to a layer name ensures that other people in your organization can also complete this tutorial. Once a layer has been created, you can rename it in the map to remove your initials, which will not affect the name of the underlying data layer.
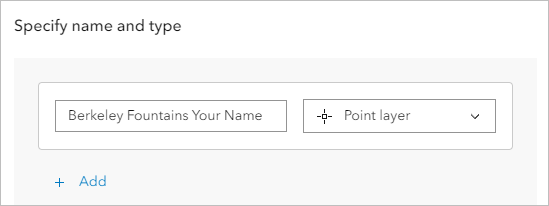
You can also enable other options, including GPS metadata fields and Z-values (3D). You won't need either of these options, so you'll leave them unchecked.
- Click Next.
The New item window appears. You'll add metadata for your new layer, such as its search tags and description.
- For Tags, type Fountains and press Enter. For Summary, type A layer to collect the locations and conditions of drinking fountains in Berkeley, California.
- Click Save.
The feature layer is created. Its details page, which contains metadata and other information, appears.
Configure fields
You've created the layer, but you still need to create a way to track whether fountains are functioning and clean. To do so, you'll configure the layer's fields. These fields can contain additional information about features. You'll create two fields: one to track whether fountains are functioning, and one to track whether they are clean or dirty.
- On the items details page, click the Data tab. Click Fields.

A list of the layer's fields appears. By default, the layer already has a few fields. One is an ID field, while the other is for containing photos and files.
- Click the Add button.
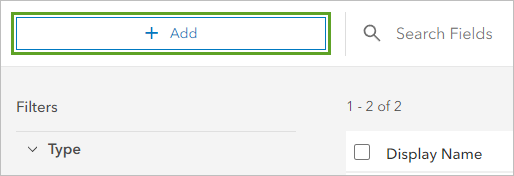
The Add Field window appears.
- For Field Name, type Functioning. For Display Name, type Functioning.
You don't need to change the field's type or give it a default value. You'll make sure users don't leave this field blank by not allowing empty or null values.
- Uncheck Allow Null Values.
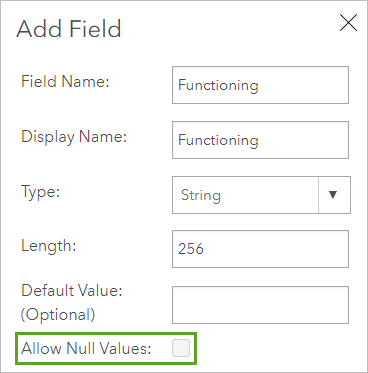
- Click Add New Field.
The Functioning field is added to the list. Next, you'll add a field to track whether the fountain is clean or dirty.
- Click the Add button. In the Add Field window, for both Field Name and Display Name, type Condition.
- Uncheck Allow Null Values and click Add New Field.
The Condition field is added to the list. Now that you've created both fields, you'll create a list of possible options users can choose for each field. For the Functioning field, you want to make sure responses are either yes or no.
- In the list of fields, under Display Name, click Functioning.
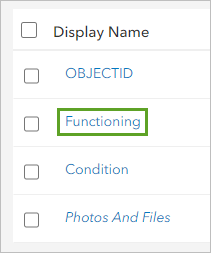
Information about the field appears.
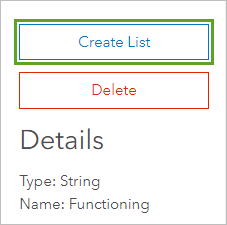
- Click Create List.
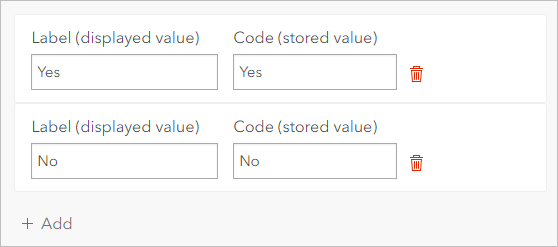
- For Label, type Yes. For Code, type Yes.
- Click Add. In the new list value, for both Label and Code, type No.
- Click Save.
With these list values, users will only be able to answer yes or no for the Functioning field. For the Condition field, you'll create list values so that users can only answer that the fountain is clean or dirty.
- In the list of fields, click Condition. Click Create List.
- Create a list value with a label and code of Clean. Click Add and create a second list value with a label and code of Dirty.
- Click Save.
Add the layer to a map
Your layer is finished. You'll add it to a map and share the map with a group. Members of that group will be able to access the map in ArcGIS Field Maps.
- On the ribbon, click the Overview tab.

- Click Open in Map Viewer.
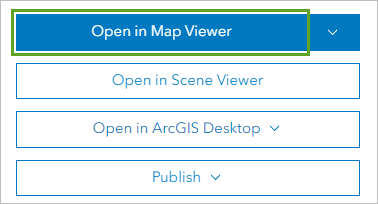
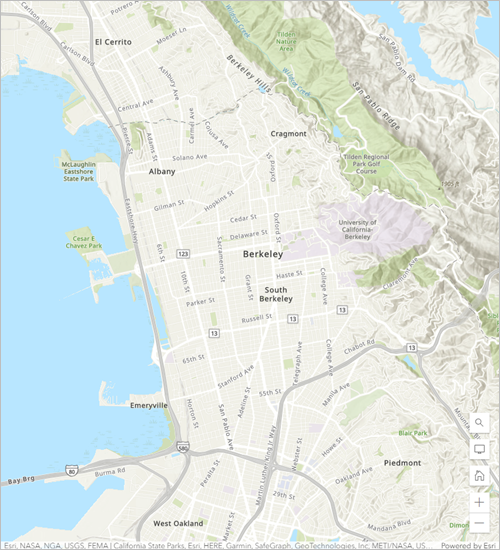
The layer is added to a new map. The layer currently has no data, so no features appear on the map. That's fine; later, you'll add features using ArcGIS Field Maps.
- On the map, click the Search button.

- In the Search window, type Berkeley, California and press Enter.
You navigate to Berkeley, a city near San Francisco.
- Close the Search result pop-up.
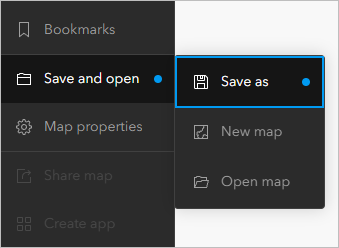
- On the Contents (dark) toolbar, click Save and open and choose Save as.
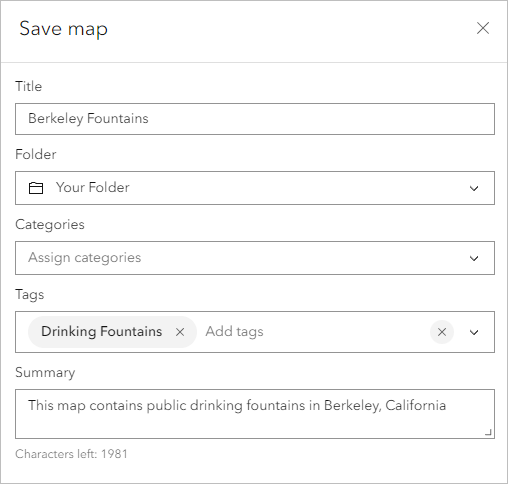
- In the Save map window, set the following parameters:
- For Title, type Berkeley Fountains.
- For Tags, type Drinking Fountains and press Enter.
- For Summary, type This map contains public drinking fountains in Berkeley, California.
- Click Save.
The map is saved. Next, you'll share it. To access a map in ArcGIS Field Maps, it must be either a map that you created or a map shared with a group of which you are a member.
For the purposes of this tutorial, you created this map, so you'll be able to access it in ArcGIS Field Maps. However, in a real-world scenario you may have multiple users collecting data who need access to your map. To share a map with other users, you need to create a group.
Note:
In a real-world scenario, your organization or teacher may have already created a group for sharing data. If so, you can skip the steps for creating a new group and share your content with the group that has already been made. You'll only be able to share content with a group if you are a member of the group.
- On the ribbon, next to the map title, click the options button and choose Groups.
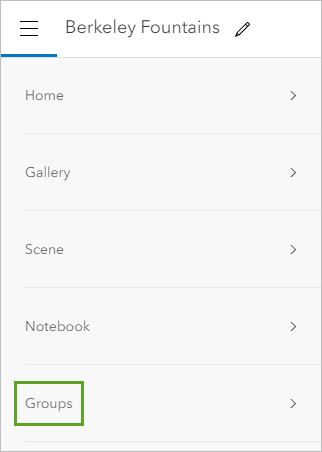
A list of your groups appears. It contains both groups you created and groups you have joined.
- Click Create group.

The Create a group window appears.
- Under Group overview, set the following parameters:
- For Name, type Berkeley Fountains.
- For Summary, type A group for collecting the locations and conditions of public drinking fountains in Berkeley, California.
- For Tags, type Drinking Fountains and press Enter.
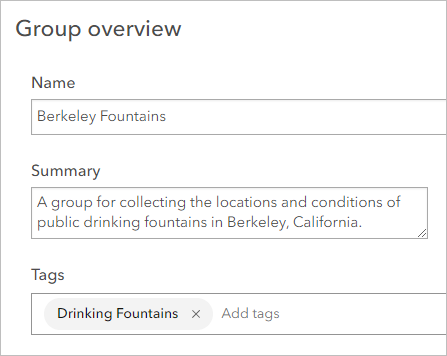
You'll also limit who can view the group.
- Under Group membership,
for Who can view this group, choose Only group members.
Choosing this option limits who can join the group. Users can only become members of the group if you invite them.
- Click Save.
The group is created and the group's details page appears. On this page, you can edit the group's description, thumbnail, and other metadata. You can also invite users.
Next, you'll share your map with the group.
- Click Add items to group.

The Add items to group window appears. It contains all of the content, including maps and layers, you have saved in your account.
- In your list of content, check your Berkeley Fountains map and your Berkeley Fountains feature layer.
Note:
Unless you specified otherwise, both the map and the layer were saved in your default folder. If you have difficulty finding the map and layer, you can search for them using the search bar.

- Click Add items.
When the items are added to the group, their sharing is updated. The map and layer are now shared with the group. Members of the group can access the map using ArcGIS Field Maps.
Collect data on a mobile device
Next, you'll collect a fictitious drinking fountain record using ArcGIS Field Maps.
- Open ArcGIS Field Maps on either your Android or iOS mobile device.
Note:
If you don't have ArcGIS Field Maps, you can download it for free as a mobile app from the App Store or Google Play.
- Click Sign In with ArcGIS Online or Sign In with ArcGIS Enterprise. Sign in with your ArcGIS account credentials.
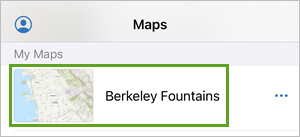
After you sign in, the maps list appears. These are all the maps that have editable data to which you have access.
Note:
Depending on the device you use to access Field Maps, your interface may differ from the example images.
- Tap the Berkeley Fountains map icon.
- If you receive a notification asking you to allow ArcGIS Field Maps to access your location, click Allow.
The map opens to your current location. This location is probably not Berkeley, California (in the example images, the location is Esri headquarters in Redlands, California).
Because the fountain you're collecting is fictitious and your goal is simply to test whether everything was set up correctly, it doesn't matter where you add a feature. In a real-world scenario, users would travel around the city and add features wherever they found a fountain.
- On the map, tap the add button.
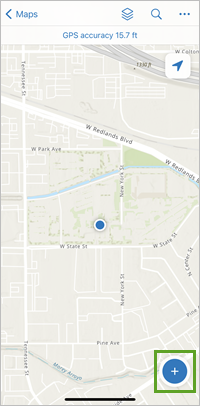
The Fountains form appears. If your phone's GPS accuracy is sufficient, your location is used as the location of the new fountain feature. (You can change the location by dragging the point on the map.)
Note:
If your phone's GPS has low accuracy and your location wasn't used, tap Add Point and click Use Poor Location. You can also collect data at a location other than where your GPS is locating the phone. Click the search button (the magnifying glass) and type the address. Click the correct search result to navigate to the address's location and click Collect here.
The Fountains form contains the latitude and longitude of your new fountain feature, the option to update the feature's location, and options to take a photograph of the fountain or attach a file with more information. You can also add information for the fields you previously created. When you made these fields, you disallowed null values, so both fields are required.
- In the form, tap Condition. (You may have to scroll.) Choose Dirty.
- In the form, tap Functioning. Choose Yes.
- If you want, tap Take Photo and take a photograph of any nearby object.
Note:
You may need to give Field Maps access to your mobile device's camera. Tap OK to allow.
- Tap Submit.
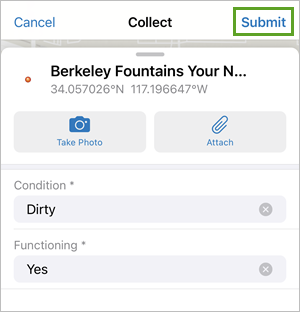
The fountain's data has been collected. You'll check your original web map to confirm that the fountain feature was added to it.
- On your computer, in the Berkeley Fountains group, click the Berkeley Fountains web map. On the details page, click Open in Map Viewer.
Note:
If the Open map window appears, telling you the current map has unsaved changes, click Yes, open the map.
Map Viewer opens to the City of Berkeley.
- On the web map, navigate to the location where you added your fountain point.
Note:
Depending on where you added your point, it may not appear in the map's default extent. To navigate quickly, you can search for the location in the search bar.
The fountain point is displayed as a red circle.
- Click the fountain point.
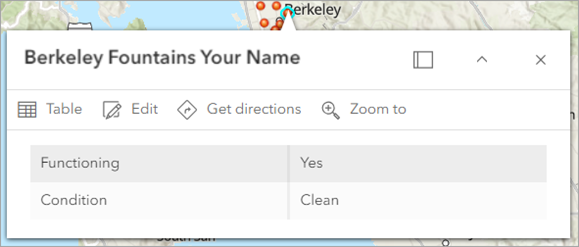
The fountain's pop-up opens. It contains the values you chose for the Functioning and Condition field. These values also appear in the layer's attribute table.
You've confirmed your layer is functional. You'll delete the fictitious point so it doesn't interfere with subsequent analysis.
- In the pop-up, click Edit.
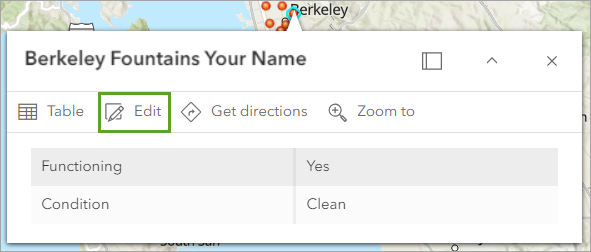
- In the Edit feature pane, click Delete. When asked to confirm, click Delete.
The point is deleted.
- Use the Search button to navigate back to Berkeley, California. Save the map
You created a layer to collect information about drinking water fountains in Berkeley, California. You also added mandatory fields to track the condition of the fountains and added the layer to a new web map. In Field Maps, you added a fictitious fountain to test your layer's functionality.
In a real-world scenario, users would use your layer to collect information about actual fountains throughout the city. Next, you'll use the results those users collected to determine whether fountains (and by extension, access to clean drinking water) are distributed equitably across the city.
Analyze fountain distribution
Previously, you collected information about the location and condition of public drinking fountains in Berkeley, California. Next, you'll analyze the distribution of fountains. In particular, you'll determine if fountains are distributed equitably.
The concept of environmental justice implies that resources (parks, fountains, fire stations) and burdens (incinerators, wastewater treatment plants, landfills) are equally distributed, regardless of demographic factors such as household income or race.
You'll answer the following questions: Is the location and condition of fountains in Berkeley an environmental justice issue? Do some census tracts have more dirty fountains than others? Are differences in the number of dirty fountains related to the social vulnerability of the census tract?
Add demographic and fountain data
To perform your analysis, you'll need data about the demographics in Berkeley and the fountains in Berkeley. While you previously created a layer for collecting fountain information, without actual fieldwork you won't have a complete Berkeley fountain dataset. For the purposes of this exercise, you'll add fountain data that was collected by students at the University of California, Berkeley.
First, you'll add demographic data that shows the social vulnerability of areas around Berkeley. You'll add this data from ArcGIS Living Atlas of the World, Esri's collection of authoritative data.
- In the Layers pane, click Add.
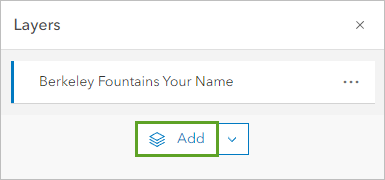
- In the Add layer pane, click My content and choose ArcGIS Online.
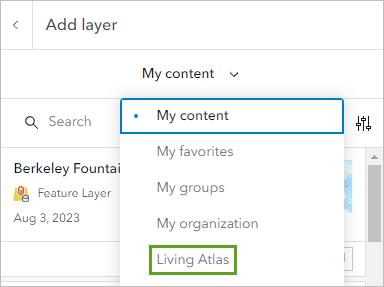
- In the search bar, type CDC/ATSDR Social Vulnerability Index.
The Centers for Disease Control and Prevention (CDC) is the United States government's health protection agency. Its Social Vulnerability Index (SVI) measures how well a community can withstand disasters or health hazards. It is based on demographic variables collected by the United States Census Bureau. Read more about SVI.
- In the search results, for CDC/ATSDR Social Vulnerability Index 2022 USA by Centers for Disease Control and Prevention, click Add.
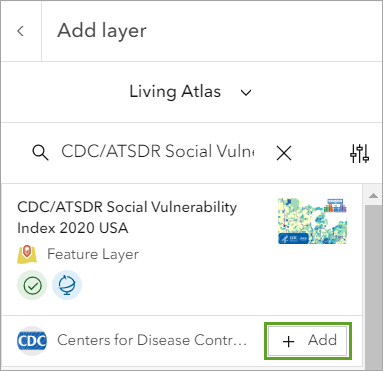
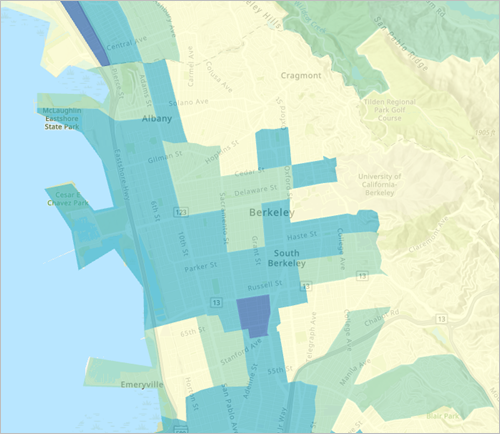
The layer is added to the map. Darker blue census tracts are those with the highest SVI, while yellow census tracts have the lowest SVI. The dataset covers the entire United States, but you're only interested in Berkeley.
Next, you'll add a layer showing the Berkeley city limits. The layer is owned by the Esri_Tutorials administrator account.
- In the Add layer pane, choose ArcGIS Online.
- Clear the existing search text and type Berkeley City Limits owner:Esri_Tutorials.
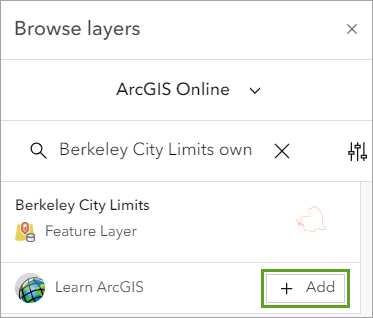
- For the Berkeley City Limits layer, click Add.
The layer is added to the map. Next, you'll add two fountains layers. One contains all of the dirty fountain data collected in Berkeley, while one contains only clean fountains.
- Replace the existing search text with Berkeley Fountains owner:Esri_Tutorials.
- Add the Berkeley Fountains (Clean) and Berkeley Fountains (Dirty) layers.
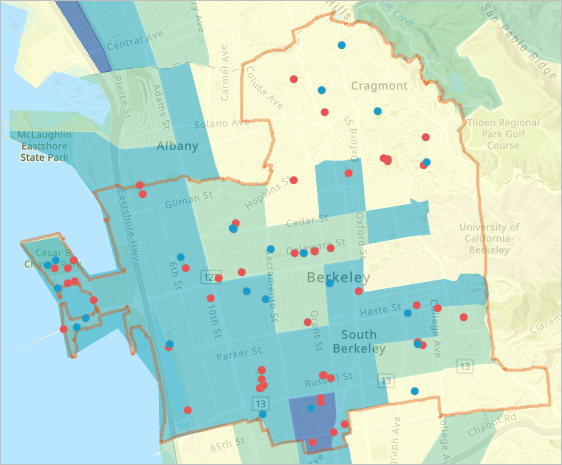
On the map, red fountains are those that were found to be clean, while blue fountains are those that were found to be dirty, littered, or rusted. Are clean fountains located primarily in census tracts with low SVI? Are dirty fountains located primarily in census tracts with high SVI? It can be difficult to reach a conclusion unless you perform analysis. First, you'll change the basemap to show labels on top of the CDC Social Vulnerability Index layer for context, then you'll perform analysis.
- In the Add layer pane, click the back button.

- On the Contents toolbar, click Basemap.
- In the Basemap pane, choose the Human Geography Map basemap.
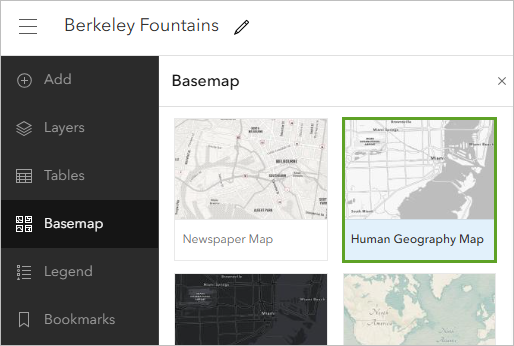
The basemap changes to the Human Geography Map. Labels are now visible on top of the CDC Vulnerability Index layer.
- Save the map.
Determine if fountains are equitably distributed
Next, you'll analyze patterns in the distribution of fountains. You'll answer the question of whether there's a connection between fountain location or condition and the social vulnerability status of a community. In particular, you'll calculate the density of clean and dirty fountains and compare that density to the SVI layer.
- On the Contents toolbar, click Layers. In the Layers pane, click the Berkeley Fountains (Clean) layer to select it.
- On the Settings (light) toolbar, click Analysis.
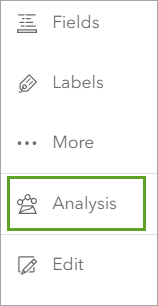
- In the Analysis pane, click Tools.
- In the search bar, type Calculate Density. In the list of results, click the Calculate Density result with a tool icon.
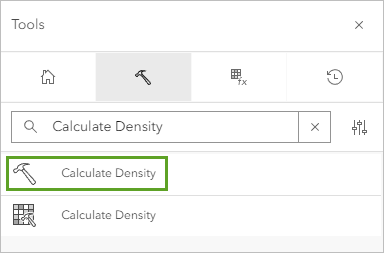
The Calculate Density tool opens. This tool creates a layer that shows the density of point features (such as your fountains layer) in a given area.
- Under Input layers, for Input point or line features, click Layer and choose Berkeley Fountains (Clean).
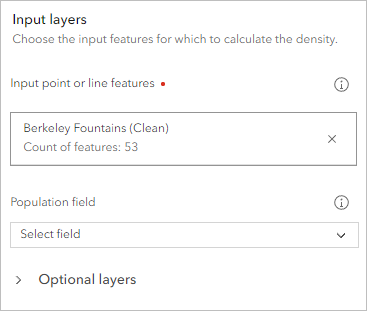
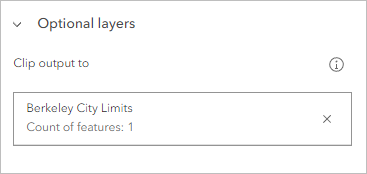
You'll limit the extent of the layer that the tool creates so that it does not extend past the Berkeley city limits.
- Expand Optional layers. For Clip output to, click Layer and choose Berkeley City Limits.
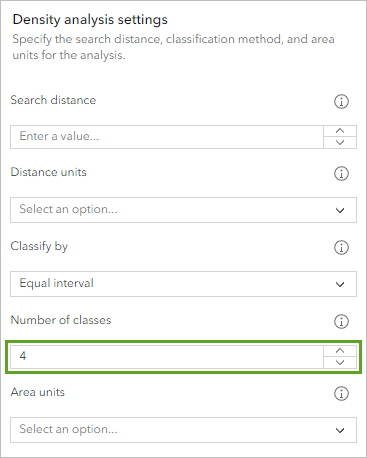
You can also change the method by which density is classified. By default, the result layer will display 10 different classes of density and each class will contain an equal interval of values. Ten classes is too many for your relatively small dataset.
- Under Density analysis settings, for Number of classes, choose 4.
- Under Result layer, for Output polygon name, type Berkeley Fountains Clean Density and add your name or initials.
- Click Run.
After a few seconds, the new layer is created and added to the map. The darker purple areas are those with a higher density of clean fountains.
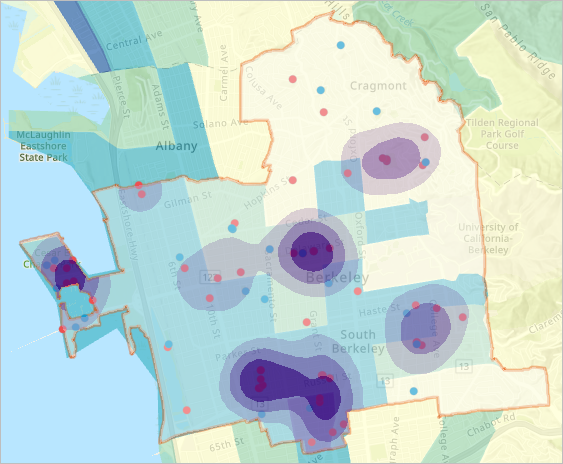
Based on the highest-density areas, it does not seem that the location of clean fountains is related to the social vulnerability status of the census tract. Clean fountains are found in both neighborhoods with a high SVI (darker blue census tracts) and neighborhoods with a low SVI (light green or yellow census tracts).
The high density of clean fountains in the westernmost census block may be due to its location in the Berkeley Marina, a tourist and recreational area. While your analysis doesn't indicate an inequitable distribution of clean fountains, it still highlights areas where access to clean fountains is lacking.
Next, you'll repeat the density analysis for dirty fountains.
- In the Layers pane, point to your Berkeley Fountains Clean Density layer and click the Visibility button.
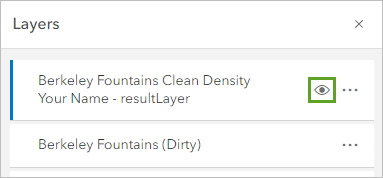
The layer is hidden on the map.
- In the Calculate Density pane,
for Input point or line features, choose Berkeley Fountains (Dirty).
Tip:
If you closed the Analysis pane, you can reopen the Calculate Density tool with all the parameters you used in the History pane. On the Settings toolbar, click Analysis. In the Analysis pane, choose History. For the Calculate Density run, click Options and choose Open tool. - Confirm that Clip output to is set to Berkeley City Limits.
- Confirm that Number of classes is set to 4.
- For Result layer name, type Berkeley Fountains Dirty Density and add your name or initials. Click Run.
The new layer is added to the map.
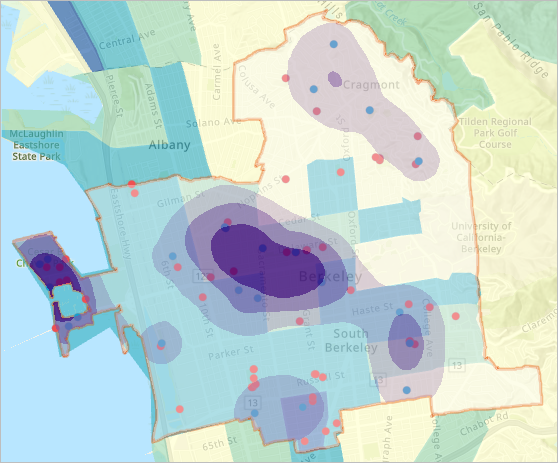
There are two areas with high densities of dirty fountains. The first is in the Berkeley Marina, and likely affects tourism more than residential conditions. The second is in the center of the city, bridging four census blocks with a wide range of SVIs.
As with clean fountains, it does not seem as though the condition of drinking fountains corresponds with the social vulnerability of the area. However, that does not mean that your analysis didn't have value. By determining areas with the highest density of dirty fountains, you pinpoint locations that the city can target to improve fountain conditions.
- Save the map.
When you save the map, the Review sharing window opens. Because your web map is shared to your Berkeley Fountains group, you can use this window to update the sharing of your two new density layers to match. If you don't update the sharing, members of your Berkeley Fountains group won't be able to see the density analysis layers. You can also change the sharing permissions later from your My Content page.
- In the Review sharing window, click Update sharing.
In this tutorial, you created an editable feature layer that users can use in Field Maps to collect information about drinking water fountains in Berkeley, California. You then analyzed the condition of drinking fountains and compared the results to the social vulnerability of the area.
Your results indicated areas where fountains could be cleaned up or more fountains could be added to increase equitable access to fountains.
You can find more tutorials in the tutorial gallery.

