Crowdsource student hangouts
Create a survey
First, you'll construct the survey for you and your classmates to fill in. Most importantly, you want to know where each facility is. Collecting the location of each park or community center will allow you to map them later and see if there are patterns in the distribution and condition of the facilities. Once you've added the location question, you'll add questions to gather more detail about the facility.
You can create a single survey as a group, or have each classmate create one and then choose the survey for everyone to use in the field. Either way, all the data should be collected from a single survey.
- Go to the ArcGIS Survey123 website and sign in with your ArcGIS organizational account.
Note:
If you don't have an organizational account, see options for software access.
- Click New survey.

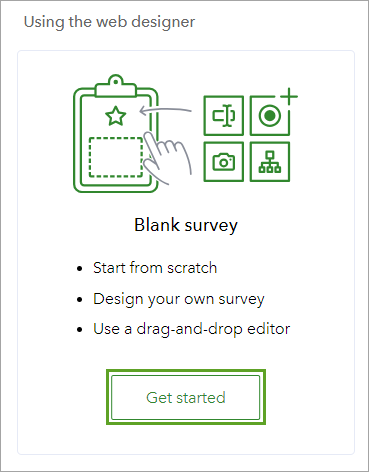
- Under Using the web designer, for Blank survey, click Get started.
The files required for your survey are generated and saved in ArcGIS Online.
By default, your survey's name is Untitled survey. You'll rename it.
- On the ribbon, click Untitled survey, type Crowdsource student hangouts, and press Enter.

You'll also change the title that displays to users.
- Click Survey title not set.
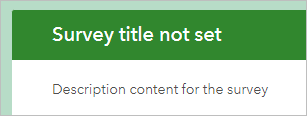
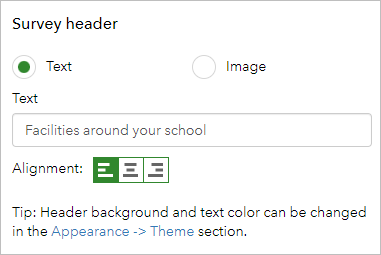
The Edit pane shows options for changing the survey header.
- In the Edit pane, for Text, type Facilities around your school.
- In the survey, click Description content for the survey. In the Edit pane, for Survey description, type A survey to collect information about facilities in or near your school.
The header has been updated with information users will see when they start the survey.

You're ready to add questions to your survey.
Add questions
You can create questions in your survey by dragging the question type from the list (on the right) to the survey page (on the left). Throughout this tutorial, you'll add questions relating to the facility's location and the people found there. The first question will be a Map question, which allows you to add the location of the surveyed item.
- In the Add pane, under Location, click Map.
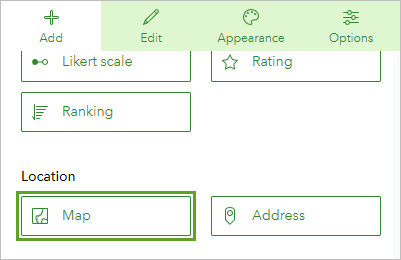
The question is added to the survey and the Edit pane appears.
- For Label, type Where is the facility?
Your survey now has one question. Only one location question in a survey can submit data. Any further Map questions will not submit a location.
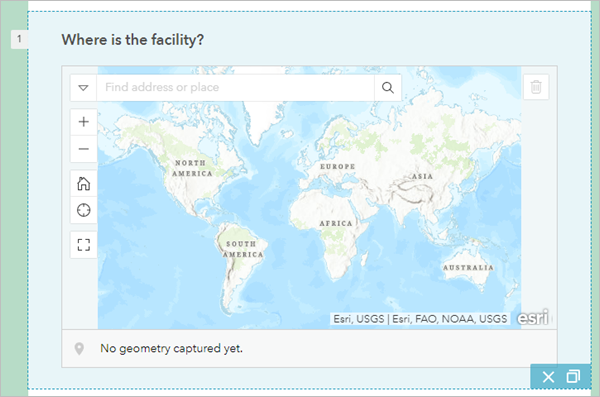
In the Edit pane, you can change several attributes of the map. For example, the default way to answer the question is to add a point. Depending on the type of location you're interested in, it can also collect a line or polygon. You can also make this question one that users are required to answer.
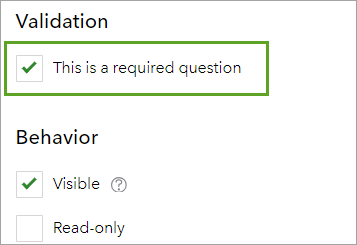
- Scroll down the Edit pane. For Validation, check This is a required question.
Next, you'll ask questions about the type of place.
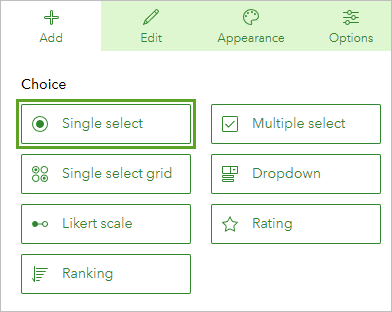
- At the top of the Edit pane, click the Add tab. Under Choice, click Single select.
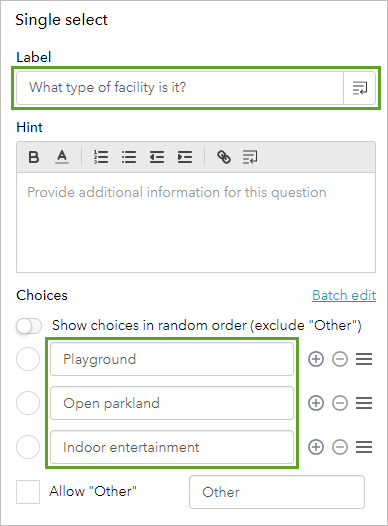
- In the Edit pane, change Label to What type of facility is it?
- Under Choices, add three choices: Playground, Open parkland, and Indoor entertainment.
- Add three more Single select questions:
- For the third question, change Label to Describe the condition of the facility and add three choices: Well maintained, Somewhat maintained, and Not maintained.
- For the fourth question, change Label to Is it accessible after dark? and add two choices of Yes and No. For the unused third choice, click the delete (minus) button.
- For fifth question, change Label to Is there adequate lighting? and add two choices of Yes and No. Delete the unused third choice.
The final question you added, Is there adequate lighting? is dependent on the previous question, Is it accessible after dark? (question 4). Because the question is dependent, it should only be displayed if the respondent answered yes to the previous question. To create this behavior, you'll set a rule.
- Click question 4 to select it. Click the Set rule button.
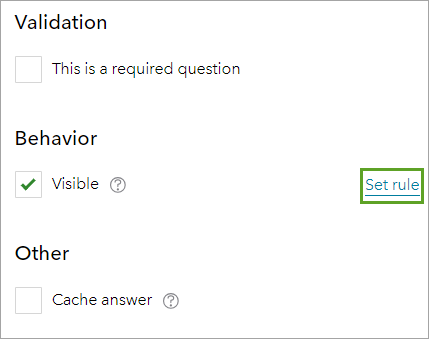
In the Set Rule window, you can add if-then conditions. If a specific answer is chosen, you'll show a specified response.
-
In the Set Rule window, for If, choose Yes, and for Show, choose 5. Is there adequate lighting?.
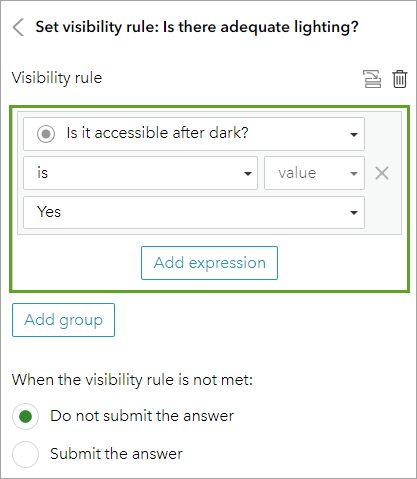
- Click OK.
The questions are now marked with arrows to show they are linked.
- In the Add pane, under Text, number, date, and time, click Number. In the Edit pane, change Label to How many people can it accommodate?
- For Hint, type or paste Enter an estimate to the nearest 10. For
Validation, check the Must be an integer box.
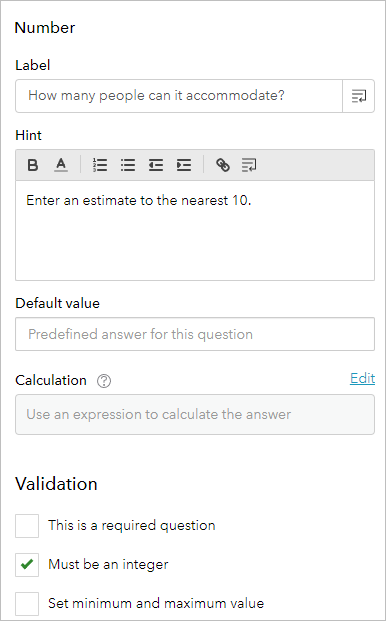
It's possible that your new question was added to the survey after the fourth question, instead of the fifth. You can reorder the questions in the survey by dragging them.
- If necessary, on the survey, drag How many people can it accommodate so it appears under Is there adequate lighting.
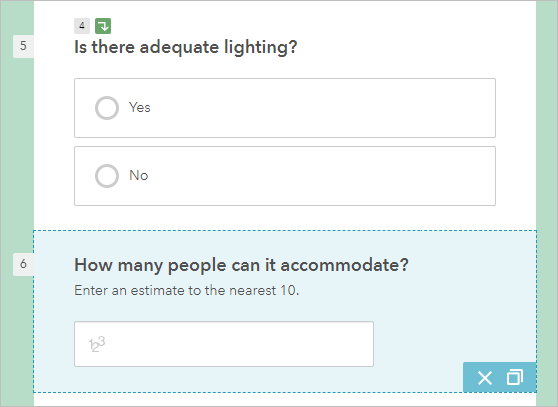
Lastly, you'll add a few questions about the facility at the time when the survey was taken.
- Add another Number question with the label How many people are currently using the facility? Check the Must be an integer box.
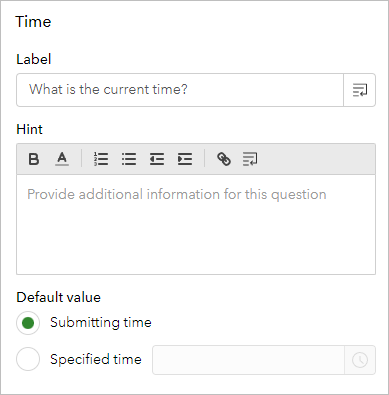
- In the Add pane, under Text, number, date, and time, click Time. Change Label to What is the current time?
- For Default Value, choose Submitting time.
- Click Save.

Note:
You can optionally click Preview to see what your survey will look like to users completing the survey.
- Click Publish. In the Publish Survey pane, click Publish to confirm.
The publishing process may take a few minutes. Once it is completed, your survey is ready to share with others.
Share your survey
Now that your survey's published, you're ready to start collecting data. Discuss with your class group which survey will be used by everyone and share that survey. All people filling in the survey should use just one survey so that all the results are stored in the same file in ArcGIS Online. After choosing which survey will be shared, the owner of that survey should follow these steps.
- On the survey ribbon, click the Collaborate tab.

- For Who can submit to this survey, click Members of my organization.

This setting allows anyone in your organization with the survey link to complete your survey. Alternatively, you may choose to share your survey with everyone. When your survey is public, each survey submission is anonymous. If you want to know who has completed your survey (and how many times), share your survey with members of your organization or an ArcGIS Online group. When you share in this way, ArcGIS Online user information is included in each survey response.
- Click Save.
You can now distribute the link for your survey to your class. You can do one of the following:
- Under Link, copy and paste the link to your survey.
- Next to the link, click the Show the QR code button to display or print the QR code.
- Click the Open the survey in a new tab button.
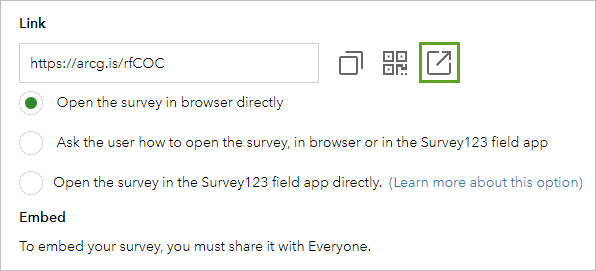
Surveys created in the ArcGIS Survey123 website can be filled in either on the web or in the ArcGIS Survey123 field app. This tutorial assumes that you will be filling in your survey on the web.
- Conduct at least five surveys. When each survey is complete, refresh the page and fill out another.
If you're a self-learner, you may need to fill out the surveys on your own. If you're in a classroom setting, ask your classmates to submit answers to the survey.
If your class regularly uses ArcGIS Survey123, or if you need to be able to fill out your survey while offline, you may choose to use the ArcGIS Survey123 field app. To download the ArcGIS Survey123 field app on iOS or Android, search for ArcGIS Survey123 in the app store. To download the ArcGIS Survey123 field app for your desktop, go to the ArcGIS Survey123 resources page.
Analyze the survey results
Decide on the number of records your class wants to have to start analyzing data. You might agree that everyone will attempt to collect five locations around school over the next two days. Alternatively, you can all go out at once for a half an hour, spread in all directions from the school, and collect whatever information can be gathered in that fixed time period. Overlapping data collection of facility information at different times is a good way to analyze usage patterns. For example, one person may visit a playground before school and see there are no people there, and another may visit the same playground after school and see it full.
To complete the survey, all class members need the same survey on their device. Follow the email link or scan the QR code from the previous step to open the survey on your device.
A time estimate has not been included for this section of the tutorial. This section can be as short or long as the group chooses. More time will lead to more data collected and more to analyze.
- In ArcGIS Survey123, open your survey and click the Overview tab.

How many records are listed—1, 2, 20, 50?
Scroll to the bottom of the Overview page. How many records has each class member completed? Who collected the most?
- Click the Analyze tab.
Study the graph of what types of facilities were observed. Which is the most common? Change the representation of the question to a map—see that the different answers are shown in a different color.
Scroll to the other questions. Are there any interesting responses? What proportion of the facilities that are accessible after dark have adequate lighting?
Does time appear to influence the number of users of a facility?
- Click the Data tab. Click Open in Map Viewer.

A Map Viewer Classic window appears in your survey. Map Viewer Classic is an online tool that allows you to view your survey results overlaid with other data. You can perform geographical analysis and create maps to share with others.
- If necessary, zoom in to your study area.
- On the ribbon, click Analysis.
- Click Feature Analysis. Expand Use Proximity and click Create Drive-Time Areas.
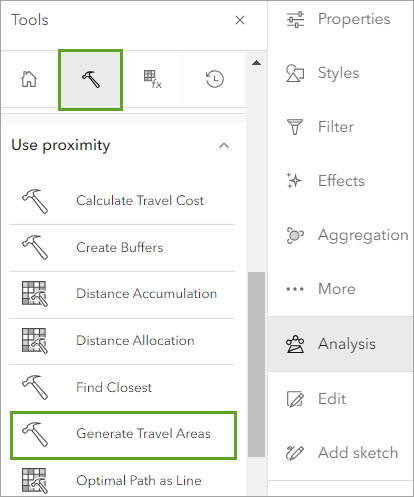
This tool creates areas that can be reached within a specified drive time, drive distance, walking distance, and so on. You'll use this tool to see what is within a 15-minute walk of your collected locations.
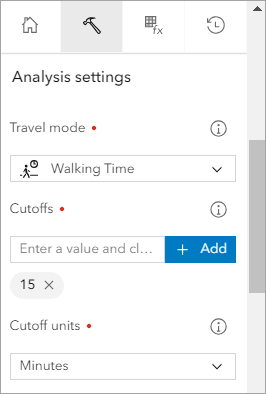
- For Measure, click Driving Time and choose Walking Time. For the time increment, type 15 and choose Minutes.
- For Areas from different points, choose Dissolve.
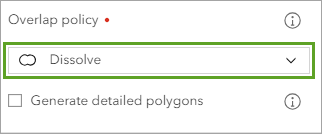
- Leave the defaults for all other sections of this tool and click Run Analysis.
- Study the walk-time results.
Do the walk-time areas overlap each other? Do they overlap your school?
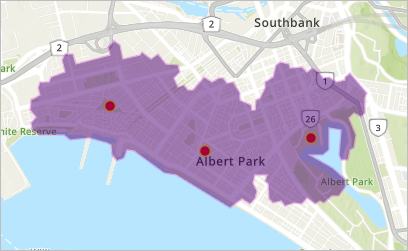
Once you've calculated these 15-minute walk-time areas, you have a polygon layer that you can perform further analysis on. Next, you'll use the Enrich Layer tool to find the total population living in the area.
- On the ribbon, click Analysis and click Feature Analysis. Expand Data Enrichment and click Enrich Layer.
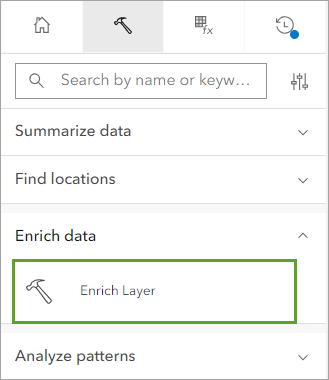
- Click Select Variables.
The Data Browser window appears. This variable contains demographic data that can be added to your layer.
- In the Data Browser window, click Population. In the Choose a Popular Variable list, choose the variable that indicates it is about total population.
Note:
The variables available may differ depending on your study area.
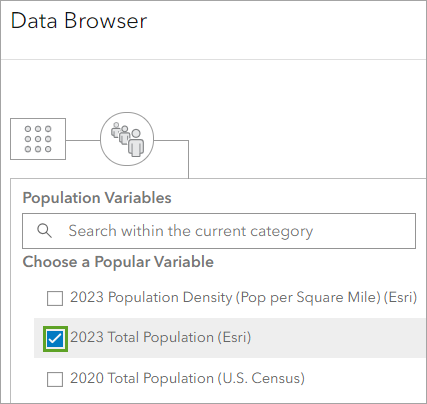
- Click Apply
- For the result layer, enter Enrich Population, add your name or initials, and click Run Analysis.
The new layer is added to your map.
- In the Contents pane, turn off every layer except Enrich Population. On the map, click the walk time area.
The area's pop-up appears.
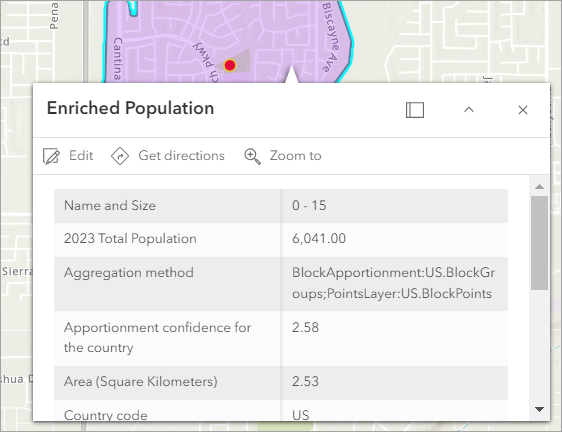
In this example, the area has a total population of 36,633. Your results will differ depending on your area of interest.
- On the ribbon, click Add and choose Search for Layers.
- Click My Content and choose ArcGIS Online.
From the Add pane, you can choose more data to add to the map. Try searching for layers to add, such as the following:
- Schools (yours and others nearby)
- Alternative places where young people may gather, for example, McDonald's or Starbucks
- Major freeways or construction areas
- Museums and nonprofit spaces
- Major freeways or railroads
- Parks and open spaces
Add these layers to your map and see if they are close to the facilities. Will they impact the usability of the facility? Do you need to cross a dangerous road to get to the facility from school? Is a new housing development going to add more demand to an already undersized playground? If there are five schools in the area and only three playgrounds, is that a sufficient number of facilities for the local community?
In this tutorial, you created a survey to collect information about existing facilities for young people in your school area. By calculating the walking-time areas to these facilities and comparing them to other layers of information, you can identify the suitability of the facilities and opportunities for improvement.
Creating surveys is a good way to collect data for analysis—either from the collection information only, or by comparing it to other existing data.
You can find more tutorials in the tutorial gallery.
