Create a scene
Start a new scene
You'll first create a scene with a 3D basemap and zoom to the study area.
- Sign in to your ArcGIS account.
Note:
If you don't have an ArcGIS organizational account, you can sign up for a free public account.
- Once you're signed in, at the top of the site, click Scene to open Scene Viewer.

Scene Viewer appears, as does a gallery of featured scenes.
- In the Scene Viewer window, click New scene.

A new scene, showing the world at a global scale, appears. You'll navigate to the area of interest: Zurich, Switzerland. Next, you'll zoom to the study area by searching for it.
- In the Search window, type Zurich, Burkliplatz and click the first result to zoom to it.

The scene zooms to Zurich and a pop-up indicates the location you searched for.
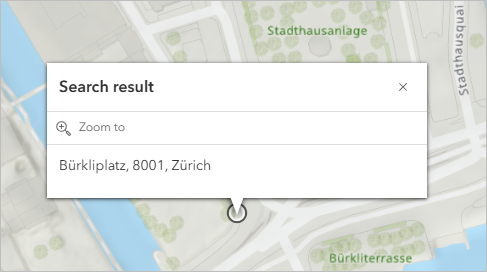
- Close the Search window and the Search result pop-up.
Next, you'll change the basemap in the scene to the 3D Topographic basemap.
- On the toolbar, click the Basemap button.
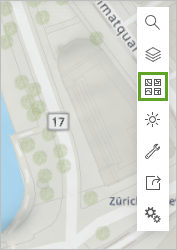
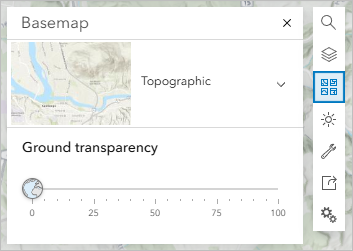
The Basemap gallery appears and indicates which basemap is currently being used.
Note:
If you're using a public account, the 3D Topographic basemap is the default. However, with other accounts, the 3DTopographic basemap may not be the default. If the 3D basemap is already selected, you can skip the step of setting it. Otherwise, perform the next step to apply the 3D Topographic basemap.
- If necessary, in the Basemap window, click the drop-down menu and click the Topographic 3D basemap.
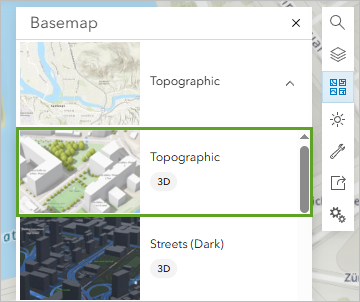
- Use the right mouse button to tilt the scene and see the 3D basemap.
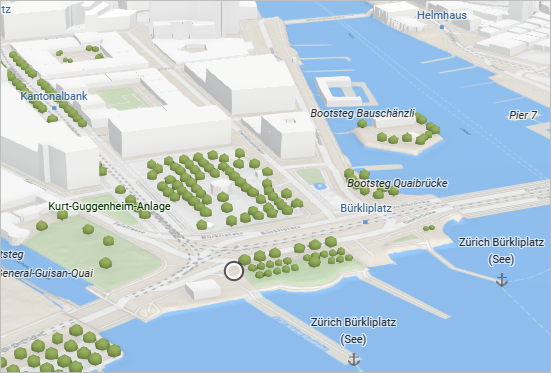
Trees and buildings now show in 3D since you changed the basemap.
Mask an area in the basemap
To enhance the study area in scene, you'll create a mask around it so that the 3D features within the mask don't display. Later, you'll add your own data to enhance the scene.
- On the scene, pan north until you see the area from the original result point to the Platspromenade, as shown in the following example image.
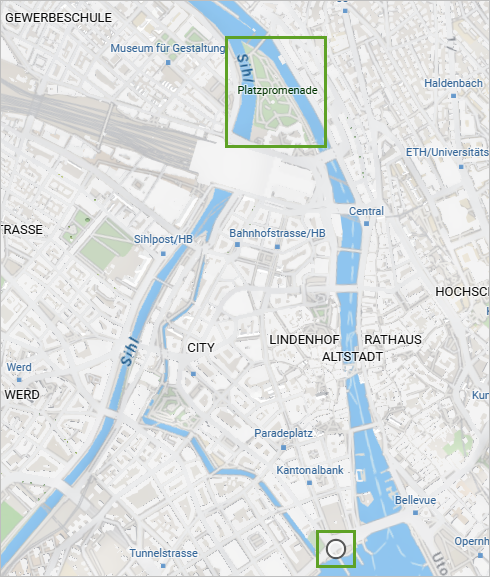
You will mask the area from the initial search point to the Platspromenade, using the rivers as boundaries.
- On the toolbar, click the Basemap button.
- On the Basemap window, for 3D layers mask, click Create.
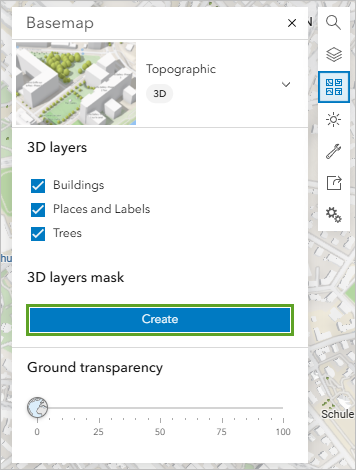
Options for creating a mask appear and the cursor changes to crosshairs.
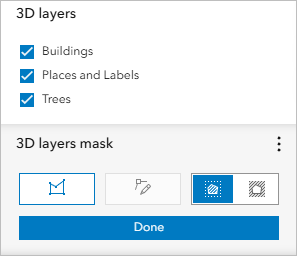
By default, the Show outside option is selected, which means everything outside the mask will be shown. Next, you'll draw a polygon on the scene to mask the study area.
- On the scene, click above the northernmost point of the study area near Platspromenade.
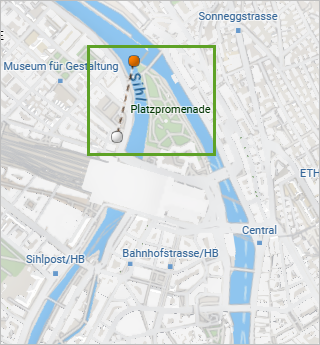
A vertex is added to the scene where you clicked. You'll continue to add vertices to draw the polygon.
- Click to add vertices that trace south down the river that is to the east of the area.
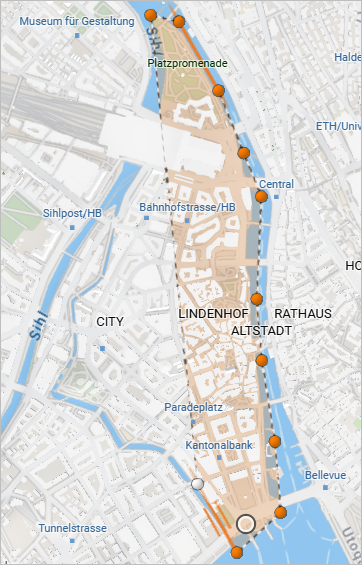
Note:
You can use the mouse scroll wheel to zoom in and out while you add vertices. You can also click and drag the scene to pan without adding a vertex. If you place a vertex in the wrong place, press Ctrl+Z on the keyboard.
- Add more vertices that trace up the river to the west of the study area. When you reach the top, double-click the final vertex to finish the mask.
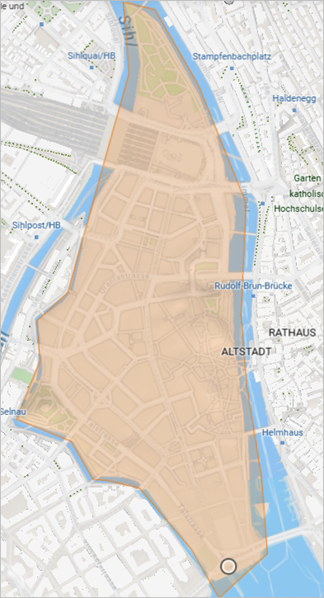
When the mask is finished, all features in the 3D basemap inside the mask are hidden.
- In the Basemap window, under 3D layers mask, click Done.
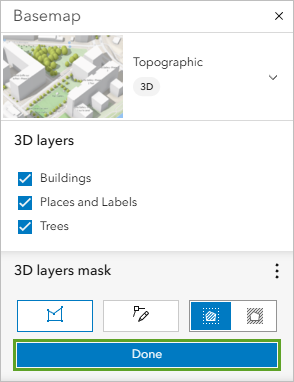
- Pan, tilt, and zoom around the scene to see the 3D features masked from the study area.
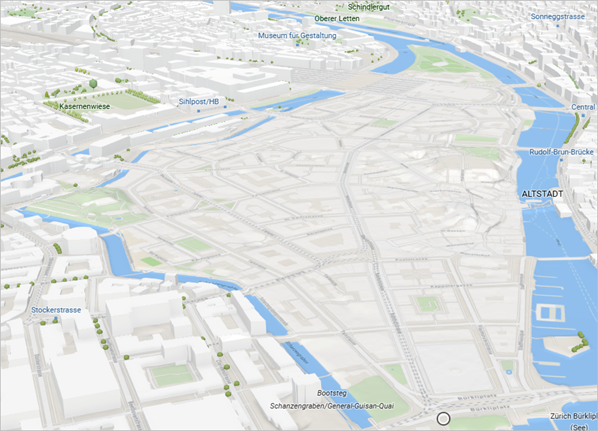
The buildings and trees from the basemap have all been removed within the mask boundary that you created. Now that you have masked the 3D features of the basemap within the study area, you'll add data layers that are specific to the area to provide more detailed data.
Add custom tree data to the scene
Next, you'll add trees and buildings layers to the scene that are more visually detailed than the default trees and buildings that were in the 3D basemap.
- On the bottom of the Designer (dark) toolbar, click the expand button.

Now the names of the buttons display. You can expand or collapse the toolbar as needed. For example, you can expand it while you work, but collapse it when you want more space in the scene to view the data.
- On the toolbar, click Add layers and click Browse layers.

- Click My Content and choose ArcGIS Online.

- In the search bar, type zurich trees.
- In the list of search results, for the Zurich Trees feature layer owned by Esri Tutorials, click Add.

The tree layer is added to the scene as 2D points.

- On the Designer toolbar, click Layer Manager and click Zurich Trees.
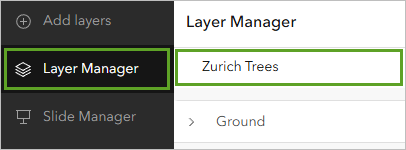
Options appear for changing the symbology.
- For Choose a drawing style, in the 3D Object option, click Select.
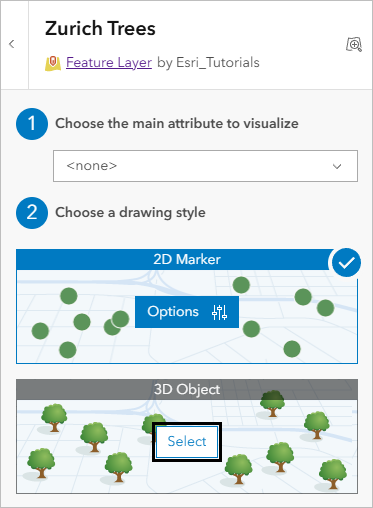
The symbols update again. Instead of flat points, each tree is represented by a 3D cone.
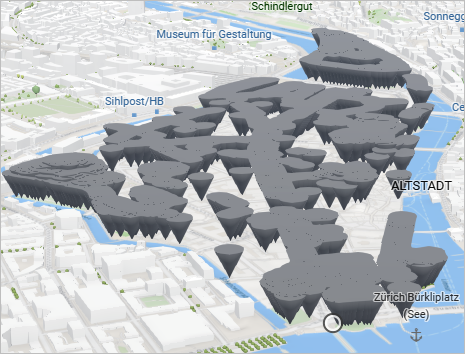
Next, you'll change the cones to symbols that look like trees.
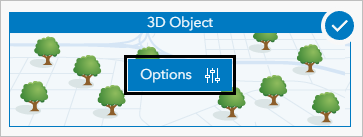
- For the 3D Object drawing style, click Options.
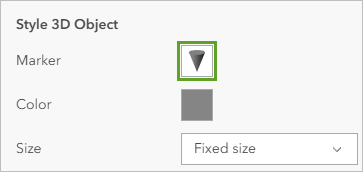
- In the Style 3D Object section, for Marker, click the cone symbol.
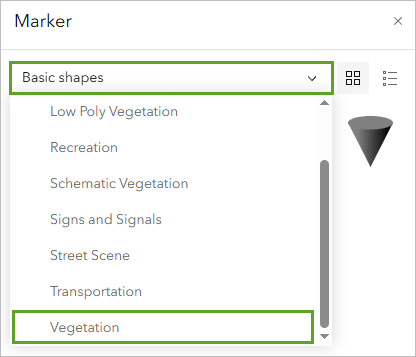
- In the Marker window, click the Basic Shapes drop-down menu and choose Vegetation.
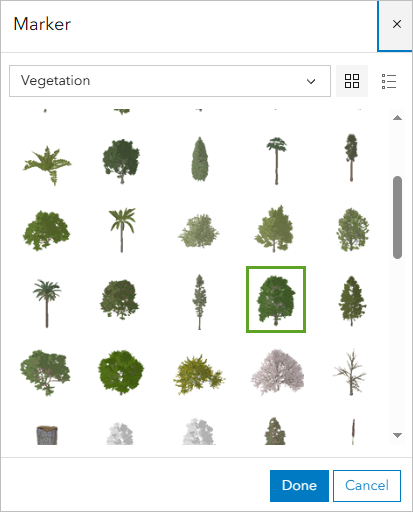
A list of vegetation symbols appears. You'll choose a tree that is common to Zurich, such as the European Beech.
- In the list of trees, click European Beech and click Done.
Note:
Point to a tree to see its name.
The trees appear on the scene and are displayed at a fixed size. You will modify the display of the trees to show them based on their height.
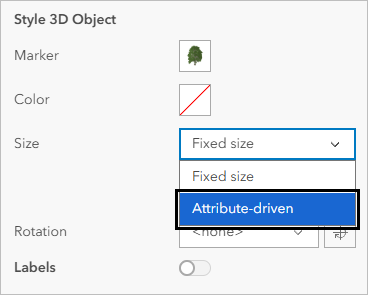
- In the Style 3D Object section, for Size, click the drop-down menu and choose Attribute-driven.
- Click the drop-down menu for Age and choose Height.
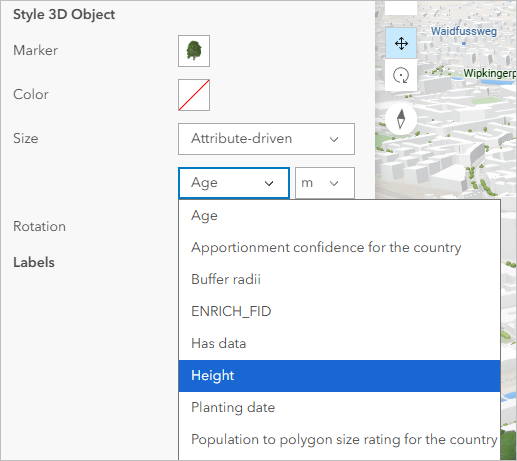
Now the trees are displayed according to their height attribute, which is more realistic than having all the trees be the same height.
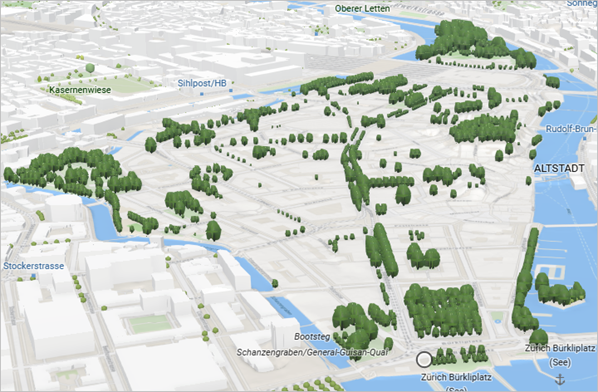
- Click Done twice and zoom and pan around the scene to see the changes.
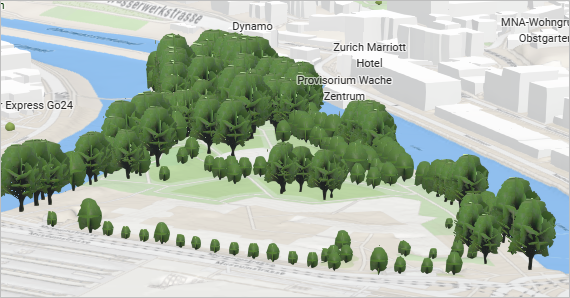
You have added a tree feature layer to the scene and changed its symbology to display the trees using a species that is common to Zurich and to show them by their height, rather than a fixed height for all trees.
Add buildings data
Next, you'll add detailed 3D features of buildings in downtown Zurich. While the basemap had basic building features, the ones you'll add have more accurate heights and roof shapes to give a realistic representation of the Zurich urban environment.
- On the Designer toolbar, click Add layers and choose Browse layers.
- In the Browse layers pane, click My content and choose ArcGIS Online.
- In the search box, type zurich buildings owner:Esri_Tutorials.
The search returns the results Zurich Buildings and Zurich Green Building.
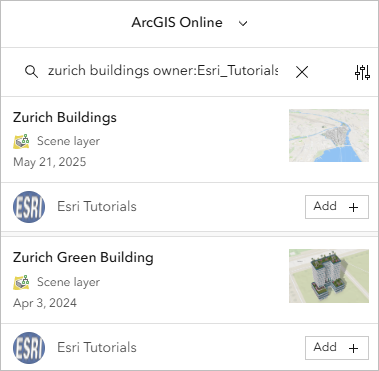
You'll add both of these layers, starting with Zurich Buildings.
- For Zurich Buildings, click Add.
- Pan and zoom around the scene to see the buildings and compare them to the buildings in the basemap that were not masked.
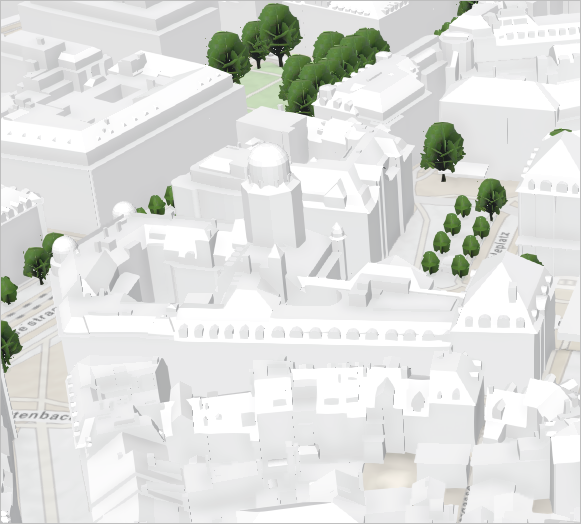
The buildings have detailed, accurate roof shapes, compared to the buildings in the basemap, which had only flat roofs. Thanks to the mask, the basemap's buildings are hidden, so there is no overlap.
Note:
3D building features with flat roofs are called level of detail 1 (LOD1), while features with more complex roofs are called LOD2.
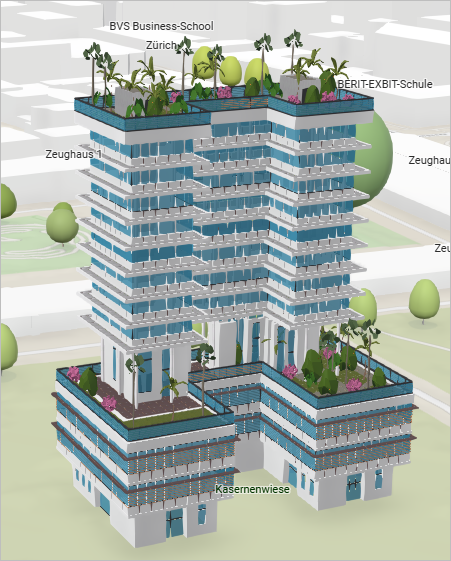
Next, you'll add a detailed building (LOD3) with even more realistic features, such as terraces and windows. It is helpful to show LOD3 buildings in an urban planning scene to visualize the proposed environment for stakeholders in the most realistic way.
- In the Browse layers pane, for the Zurich Green Building layer, click Add.
The scene automatically zooms to the building.
Note:
Learn more about the workflow for creating a building like this.
- In the Browse layers pane, click Done, and on the Designer toolbar, click Layer Manager to close the pane.
You have added a more detailed buildings layer to the study area and a LOD3 building. You can see how having your own data enhances the scene beyond the general appearance of the basemap.
Save the scene
Now that you have added the necessary data, you will save the scene to your ArcGIS account so you can continue working on it or share it with people within your organization or with the general public. First, you will set the default view for the scene.
- On the toolbar in the upper right corner of the scene, click the Layers button and next to Zurich Trees, click Zoom to.
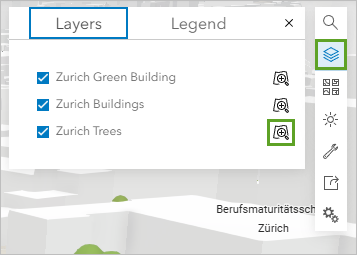
The scene zooms to the extent of the layer, which shows the study area.
- Pan, zoom, tilt, or rotate the scene to show the study area, as seen in the following example.
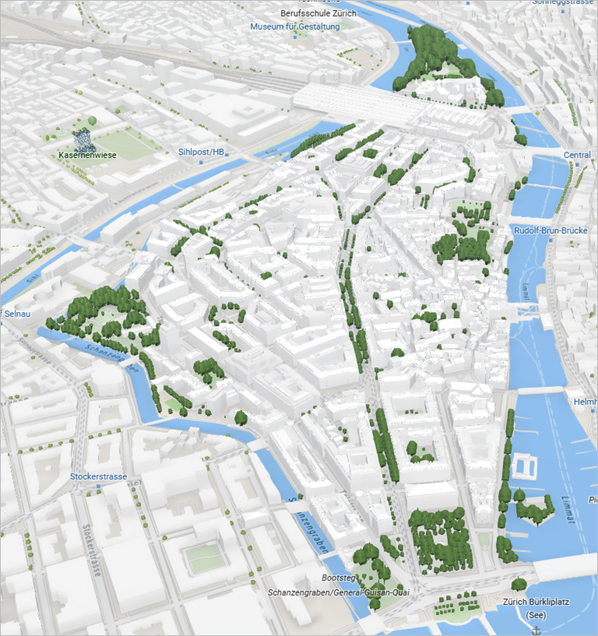
When you save a scene, the current extent is saved as the extent when opening the scene the next time. It is recommended that you show the entire area of interest before saving.
- On the Designer toolbar, click Save.
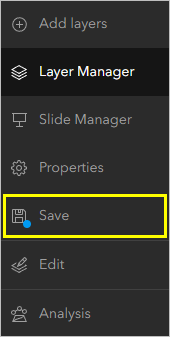
The Save scene window appears. By default, the thumbnail is set to the current scene extent.
- For Title, type Downtown Zurich. For Summary, type A scene showing downtown Zurich with buildings and trees.
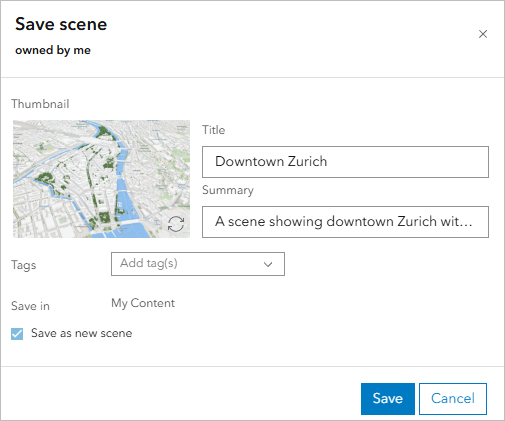
You can optionally add search tags to help others search for and find your scene.
- Click Save.
Your scene is now available on the My Content tab in your ArcGIS Online account.
Using Scene Viewer, you've masked an area of interest in the scene to remove the basemap's trees and buildings, added 2D tree locations and displayed them in 3D based on their height and species, added a more detailed 3D buildings layer, and added a proposed environmentally responsible green building. Stakeholders can use this scene to make informed decisions about urban tree management issues, visualize proposed development, and see how that will affect the area.
You can find more tutorials in the tutorial gallery.
