Configure pop-ups
Video
This tutorial is also available as a video.
Change the pop-up title and remove fields
You'll begin by reviewing the default pop-up configuration. You'll change the pop-up title and remove fields that aren't necessary.
- Open the Toll booth revenues for 2021 web map.
A map of highway toll booths in Brazil appears. The layer is symbolized to show the total revenue for each booth in 2021.
- If necessary, on the ribbon, click Sign In. Sign in with your ArcGIS organizational account.
Note:
If you don't have an ArcGIS account, you can sign up for a free public account.
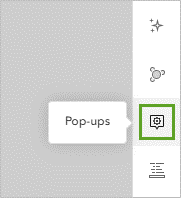
- On the Settings (light) toolbar, click the Pop-ups button.
Note:
If the Pop-ups button is unavailable, in the Layers pane, click Toll booth revenues for 2021. The Pop-ups button is only available when a layer is selected.
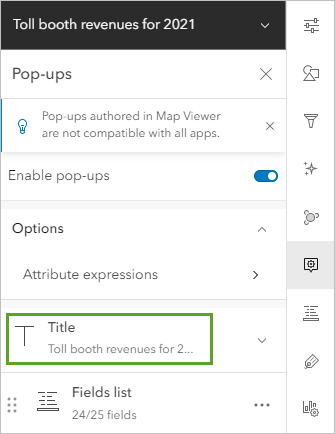
A sample pop-up appears. The pop-up's title is redundant with the map's title. You'll replace it with the name of the toll booth.
- In the Pop-ups pane, click Title.
- In the Title text box, delete the existing text. Type Toll booth:, followed by a space.
- Next to the text box, click the fields button.
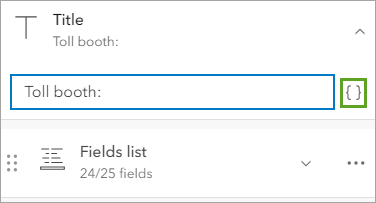
- In the Add field window, click Praca_de_pedagio.
Praça de pedágio is the Portuguese term for toll booth.
In the sample pop-up, the title updates.
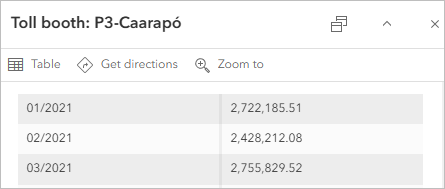
You don't need to repeat the Praca_de_pedagio field in the fields list, so you'll remove it.
- In the Pop-ups pane, click Fields list.
- Scroll to the bottom of the list of fields. Next to Praca_de_pedagio, click the remove button.
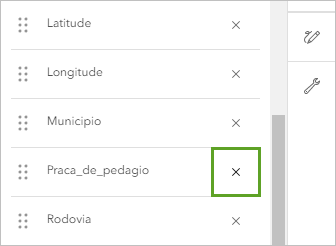
The pop-up still lists 23 fields. This is more information than you want to expose in your report. You don't want people to have to sort through unimportant fields such as Latitude and Longitude to find the information they need to interpret the map. You'll remove those fields that aren't essential to your report.
- Remove the following fields:
- Data_da_Ativacao
- Direcao
- Km_m
- Latitude
- Longitude
- Sentido
- Tipo_de_Pista
Tip:
If you accidentally remove a field, click Select fields. In the Select fields window, click the field and click Done.
The date fields—01/2021 to 12/2021—are important; they show the revenue collected at each toll booth in each month. However, a long list of numbers is difficult to interpret. You'll remove these fields too and replace them with a chart.
- Remove the 12 date fields.
Only four fields remain in the pop-up: Concessionaria, Municipio, Rodovia, and UF.
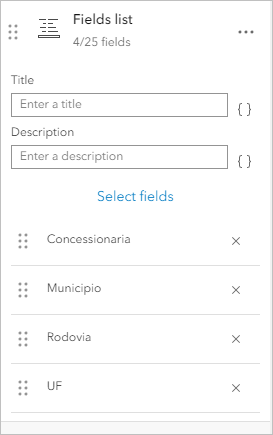
Add a chart
Next, you'll add a line chart to the pop-up to convey the monthly revenues for each toll booth. The chart will replace the 12 date fields that you removed.
- At the bottom of the Pop-ups pane, click Add content.
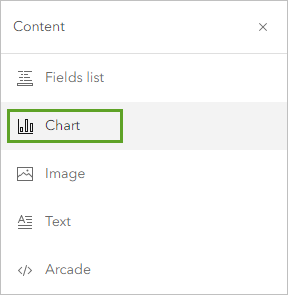
- In the Content window, click Chart.
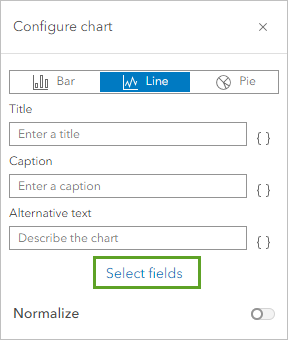
- In the Configure chart window, click the Line button. Click Select fields.
- In the Select fields window, click all of the date fields in order from 01/2021 to 12/2021.
A chart appears in the sample pop-up. It shows how revenue has changed over time for the selected toll booth.
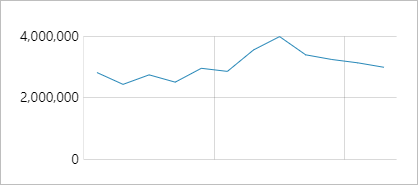
- In the Select fields window, click Done. In the Configure chart window, click Done.
You'll add a title so people will know what the chart represents.
- In the Pop-ups pane, in the Media section, for Title, type Monthly revenues in 2021 (R$).
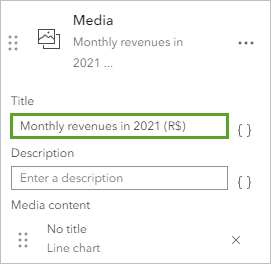
R$ is the symbol for the Brazilian real. In the sample pop-up, the title appears above the chart.
Add an expression to the Fields list
The most important values to display in your report are the total revenues for each toll booth for the year. Unfortunately, there is no field with this information. Fortunately, you can write an Arcade expression to add all the monthly revenues together. In fact, the map's symbology was created with just such an expression, and you can reuse that expression in the pop-ups.
- Near the top of the Pop-ups pane, in the Options section, click Attribute expressions.
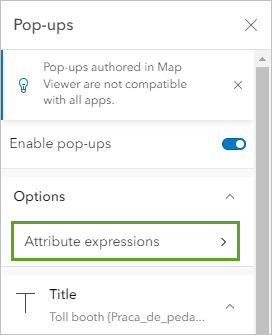
- Click Add expression.
- In the expression builder window, at the bottom of the toolbar, click the expand button.
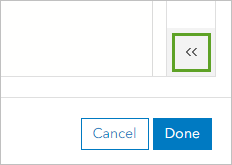
- On the toolbar, click Suggestions.
Expressions used elsewhere in the map are listed here.
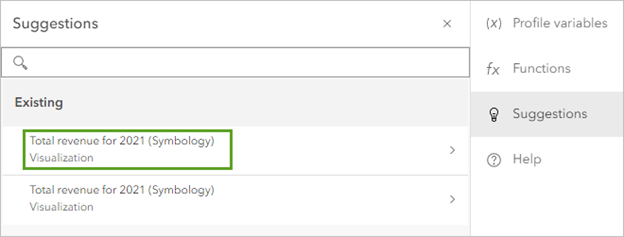
- In the Suggestions pane, under Existing, click Total revenue for 2021 (Symbology).
Note:
There are two expressions with the same name. It does not matter which one you click.
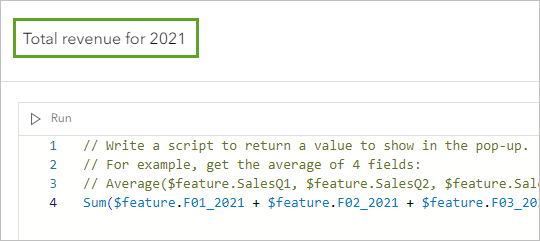
The following expression was added to the window: Sum($feature.F01_2021 + $feature.F02_2021 + $feature.F03_2021 + $feature.F04_2021 + $feature.F05_2021 + $feature.F06_2021 + $feature.F07_2021 + $feature.F08_2021 + $feature.F09_2021 + $feature.F10_2021 + $feature.F11_2021 + $feature.F12_2021).
This expression uses the Sum function to add together all of the date field values.
- In the title box at the top of the window, delete the text New expression and type Total revenue for 2021.
- Click Done.
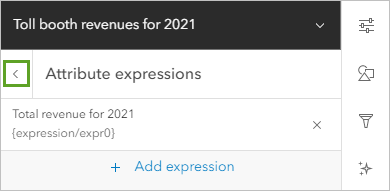
- In the Attribute expressions pane, click the Back arrow.
Next, you'll add the expression to the Fields list.
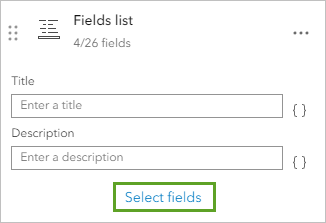
- In the Pop-ups pane, in the Fields list section, click Select fields.
- In the Select fields window, under Expressions, click Total revenue for 2021.
- Click Done.
In the sample pop-up, a new row appears in the fields list.
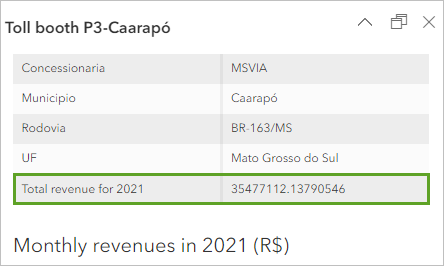
The total revenue value is the most important value for this map, so you'll move it to the top of the list.
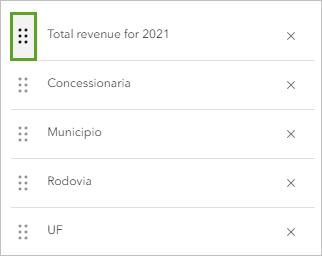
- In the Pop-ups pane, in the Fields list section, next to Total revenue for 2021, click the move button and drag the expression to the top of the list, above Concessionaria.
Format fields
In the sample pop-up, the Total revenue for 2021 value is a long number with many decimal places, and the other field names are in Portuguese. Next, you'll change the formatting of the fields to make the numbers easier to read and to make the text suitable for an English-speaking audience.
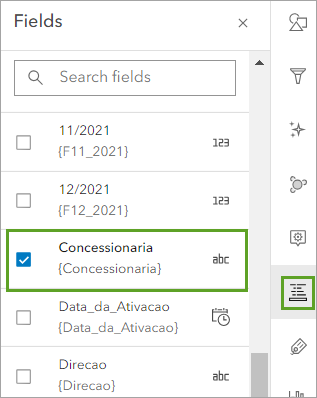
- On the Settings toolbar, click the Fields button.
- In the Fields pane, click the Concessionaria field.
- In the Formatting window, for Display name, delete the existing text and type Managing company.
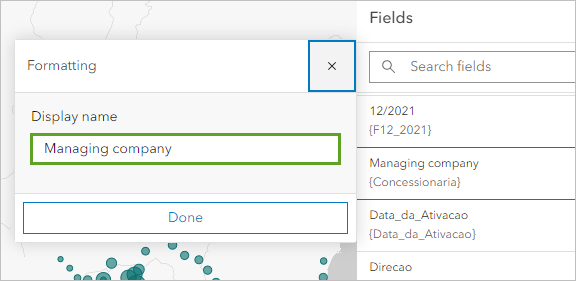
- Click Done.
The sample pop-up updates. It shows the English display name instead of the Portuguese field name.
- For the following fields, change the Display names:
- Municipio—Municipality
- Rodovia—Highway
- UF—State
- In the Fields pane, scroll to the bottom of the list and click Total revenues for 2021.
Because the values returned by this expression are numeric, more options are available in the Formatting window.
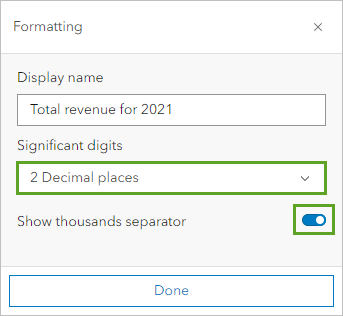
- In the Formatting window, ensure that the Significant digits value is set to 2 Decimal places. Enable the Show thousands separator option.
- Click Done.
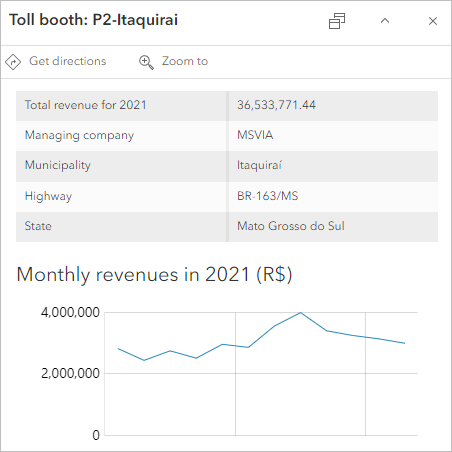
The Total revenue for 2021 value in the sample pop-up displays with its new formatting. The pop-up is complete.
- Close the Fields pane.
- Explore the map. Click various points and review their pop-ups.
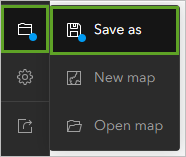
- On the Contents (dark) toolbar, click the Save and Open button. Click Save as.
- In the Save map window, accept the default settings and click Save.
The web map is complete. The pop-ups clearly convey the information relevant to your report. In this tutorial, you learned how to configure pop-ups and fields. You removed, reordered, and renamed fields. You built a chart and reused an Arcade expression.
You can find more tutorials in the tutorial gallery.


