Create an urban model for the city of Amsterdam
To begin developing projects and plan for Amsterdam’s urban planning initiatives, you will create an empty urban model. Once you have created the urban model, you will add the following important data layers for the area of interest: basemaps, parcel and zoning, space use types and building types, and project status and feedback categories. Adding basemaps and other layers to your urban model is an essential step to creating a robust model so that you can make better decisions about development and redevelopment of your area of interest.
Create the urban model and add basemaps
You will create your urban model in ArcGIS Online. First, you will change the measurement units to metric units, to match the measurements used in Amsterdam.
- Sign in to your ArcGIS organizational account.
Note:
If you don't have an organizational account, see options for software access.
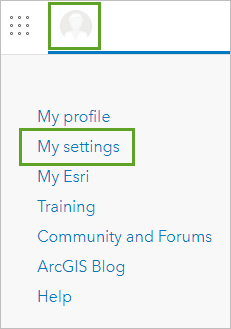
- On the ribbon, click your username and choose My settings.
- In the Units section, click Metric.
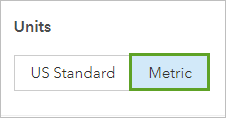
The changes are automatically saved and your units are set to metric. You can change the units back to US Standard at any time.
Next, you will create an urban model and add basemaps to it. Basemaps contain 3D representations of existing buildings and trees, and make the model look nicer and more realistic.
- On the ribbon, click the Content tab.
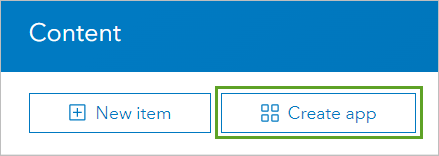
- On the Contents page, click Create app.
Note:
The menu contains many options for creating various layer types and apps. The available options in your list may be different, as they are based on the licensing for your account.
- In the drop-down menu, choose Urban.

- On the ArcGIS Urban page, click on the New button to create a new model.

- On the New dialog box, set the following properties:
- For Name, type Amsterdam Urban Model, followed by your initials.
- Leave the Template set to Empty
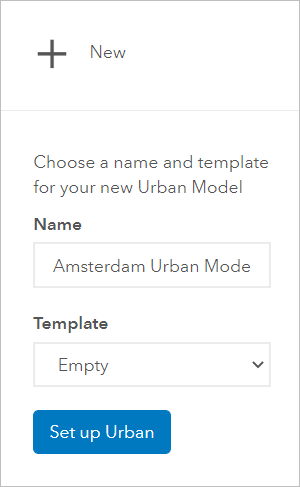
- Click Set up Urban.
An empty urban model appears showing the globe. Next, you will set the default view and add basemaps. Once you set the default view and add basemaps, you will add parcels and zoning feature layers to your urban model. You will use the basemaps and layers in your projects and plans.

- In the search field, type Amsterdam and press Enter.
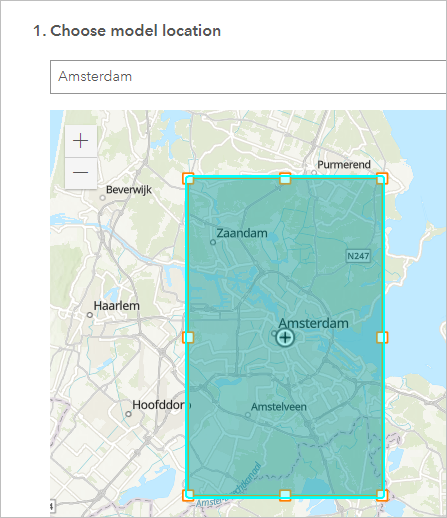
- From the search results, choose Amsterdam to zoom in. Click Back to list and close the search pane.
- Zoom out to adjust the view to Amsterdam and the surrounding areas.
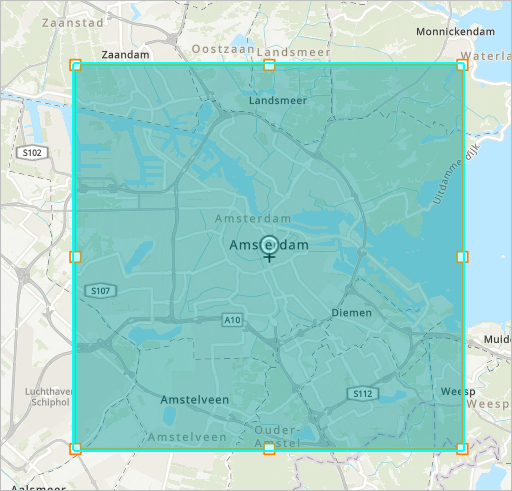
- On the ribbon, click on the Manage icon.

The Manage button opens the data manager. The data manager allows you to add, edit, and configure data in ArcGIS Urban.
- Under Default view, click Set current.
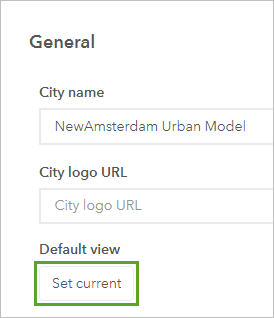
Now every time you open the overview of this model, it will automatically display the area of Amsterdam that you zoomed to.
- In the 3D base layers section, for Existing buildings layer for schematic visualization (scene layer), click the edit button.
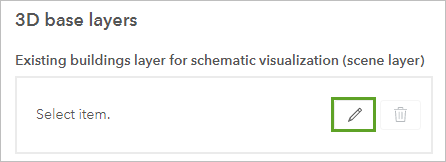
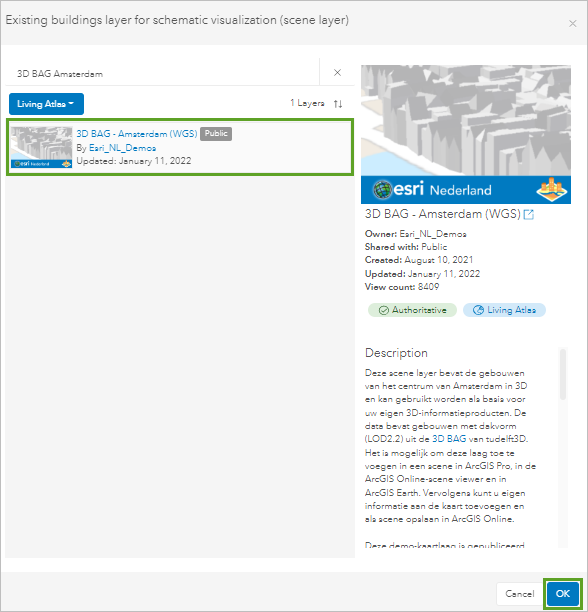
- Click My content and choose Living Atlas to search content that is publicly shared. In the search field, type 3D BAG Amsterdam and press Enter.
- Click the thumbnail for 3D BAG - Amsterdam (WGS) and click OK.
Note:
When you click on the thumbnail or the layer, the item details page for the layer will beside the search pane. A detailed information about the owner of the layer, date created and updated in shown. This section also gives you a brief description of the layer and source of the data if the owner has mentioned them.
- In the 3D base layers section, for Existing trees layer (scene layer), click the edit button.
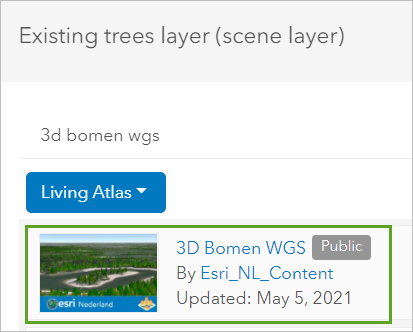
- Click My content and choose Living Atlas to search content that is publicly shared. In the search field, type 3d bomen wgs and press Enter.
- In the search results, click the thumbnail for 3D Bomen WGS.
- Click OK.
You have added two basemaps from ArcGIS Living Atlas of the World to your urban model. Next, you will add a parcels layer for the study area in Amsterdam from ArcGIS Online.
Add parcels to the urban model
Next, you will add a subset of parcel data for the Marktkwartier neighborhood, as you do not need all the parcels in Amsterdam in your urban model.
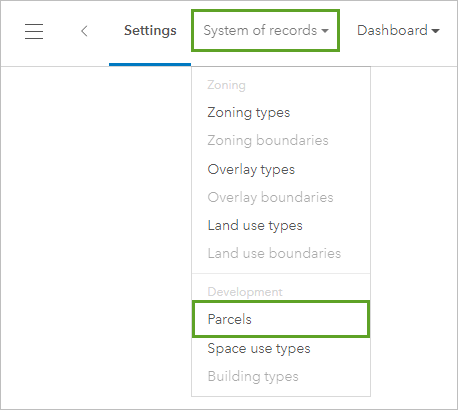
- On the ribbon, click Systems of records and choose Parcels.
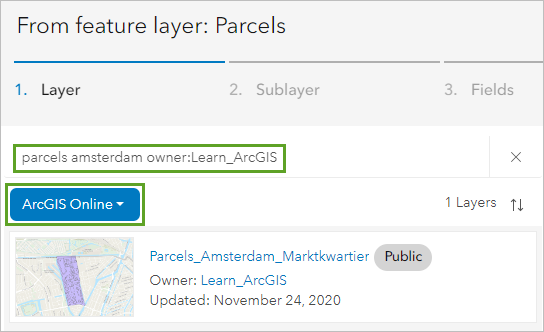
- Click Add, modify the search to ArcGIS Online, and search for parcels amsterdam owner: Learn_ArcGIS.
- Locate Parcels_Amsterdam_Marktkwartier owned by Learn_ArcGIS.
Note:
This layer only contains information for the Marktkwartier neighborhood. To add parcels for the whole city of Amsterdam, you can add Parcels Amsterdam. However, uploading the complete parcels layer takes much more time.
Next, you will verify that the field mapping is correct.
- Click its thumbnail and click OK.
Note:
This layer only contains information for the Marktkwartier neighborhood. To add parcels for the whole city of Amsterdam, you can add Parcels Amsterdam. However, uploading the complete parcels layer takes much more time.
Next, you will verify that the field mapping is correct.
- On the From feature layer: Parcels dialog box, in the Fields in Source column, make sure all the fields are set to empty (-).
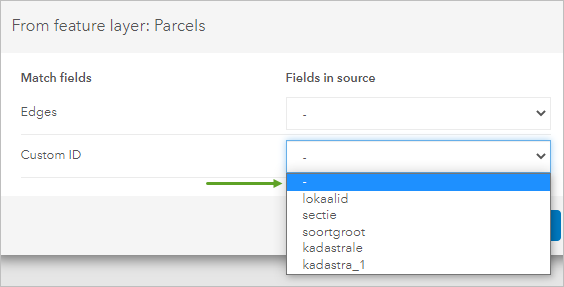
- Click OK. When the process is complete, click OK again.
The Parcels_Amsterdam_Marktkwartier layer contains 188 parcels that are now included in your urban model.
Space use and building types
You will add space use types and building types to your urban model. The data for space use types comes from Dutch regulations on space use. Building types were used from other existing urban models, and they are not specific to the Dutch context. You can always modify the building types if more precise information becomes available. You will download several spreadsheets that contain space use types, building types, and zoning types, and then add them to your urban model.
- Download the ArcGIS Urban spreadsheets zip file and extract the spreadsheets to a folder you can easily remember.
- On the ribbon, click Systems of records and choose Space use types.
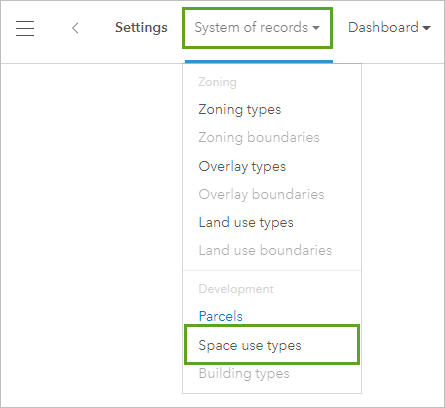
- Click Add and choose From spreadsheet.
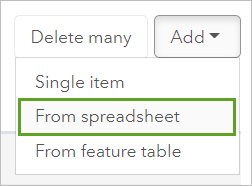
- On the From spreadsheet: space use types dialog box, click Choose file. Browse to where you saved the spreadsheets and double-click space-use-types-amsterdam.
Fields are matched automatically, so you will accept the defaults and add the new space use types.
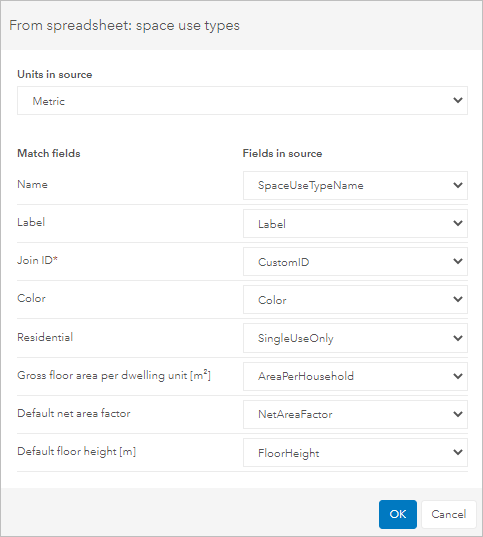
- Click OK two times to finish adding space use types.
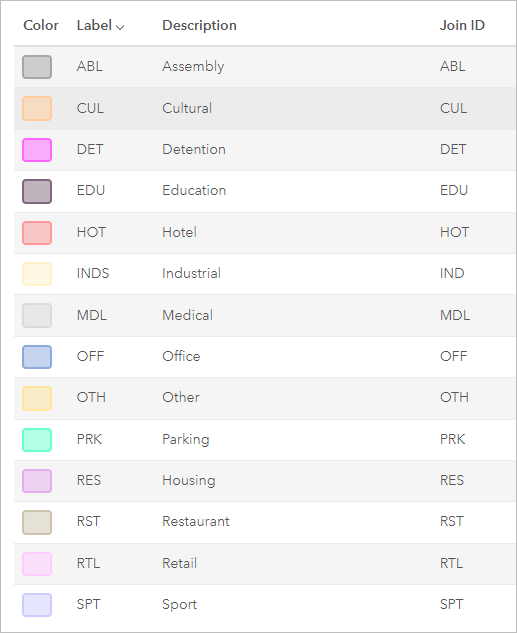
Each space use type imported from the spreadsheet is listed with its Color, Label, Description, and Join ID. Now that you have added space use types, you will add building types.
- On the ribbon, click System of records and click Building types.
You will add one building type individually so you can learn this method, and then you will add the rest of the buildings from a spreadsheet. Regardless of how you add building types now, you can always add other building types at any time.
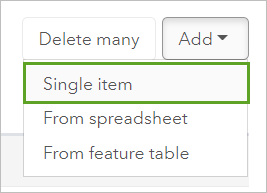
- Click Add and choose Single item.
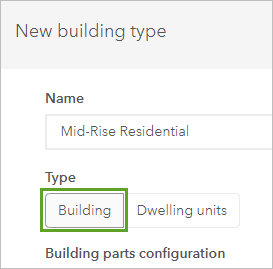
- On the New building type dialog box, for Name, type Mid-Rise Residential.
- For Type, if necessary, click Building.
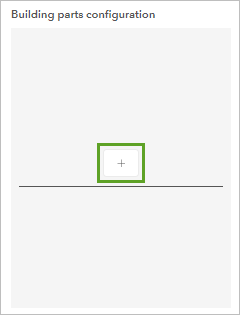
- Under Building parts configuration, click the add button.
- For Building parts configuration, set the following parameters:
- For Space use type, select Housing.
- For Number of floors (exact), type 5 for minimum and 12 for maximum.
- For Massing, select Podium.
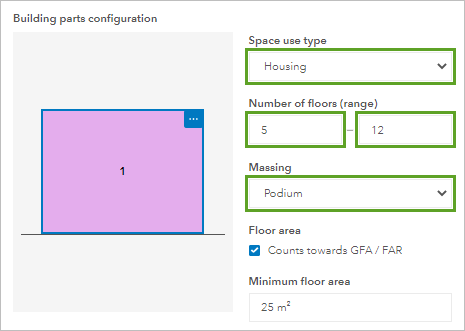
- Accept the defaults for the other properties and click OK.
Your individual mid-rise building type is now created.
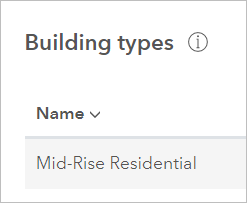
Next, you will add the remaining building types by importing them from one of the spreadsheets that you downloaded earlier.
- Click Add and choose From spreadsheet.
- Click Choose file, browse to where you saved the spreadsheets, and double-click building-types-amsterdam.
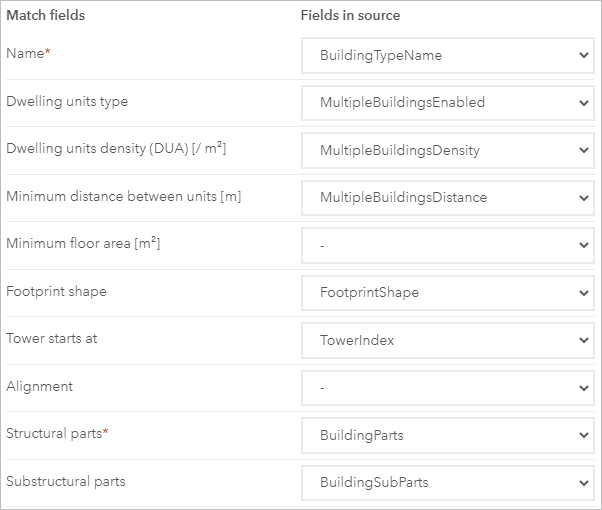
- Fields are matched automatically, click OK twice to finish.
You have successfully added space use and building types to the model by adding single items and importing many items from a spreadsheet. This information will not show up directly on the map, but it will be important when you start developing new plans.
Add zoning types and a zoning layer
Next, you will add information about zoning to the model. Zoning regulations contain restrictions on which space use types can be used in each parcel, and other building regulations. You will first add zoning types, and then a zoning layer, which displays the zoning features on the map. Data about zoning regulations comes again from the Dutch Kadaster.
- On the ribbon, click System of records and choose Zoning types.
- Click Add and choose Single item.
The New zoning type window appears.
- In the New zoning type window, in the Appearance tab, set the following parameters:
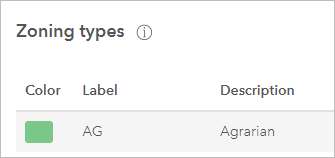
- For Label, type AG.
- For Custom ID, type agrarisch.
Note:
You can use the Custom ID to associate this zoning type with the zoning feature layer.
- For Description, type Agrarian.
- For Color, type #01991f.
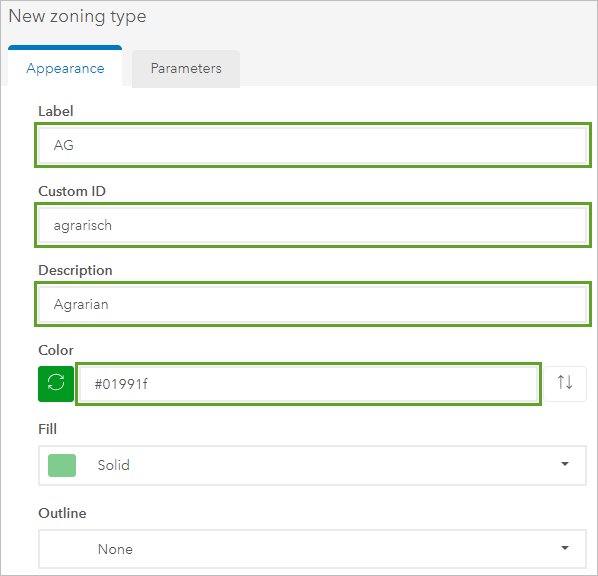
- Click on the Parameters tab and set the following:
- For Maximum coverage, type 45.
- For Maximum FAR, type 0.45.
- For Maximum height, type 7.62.
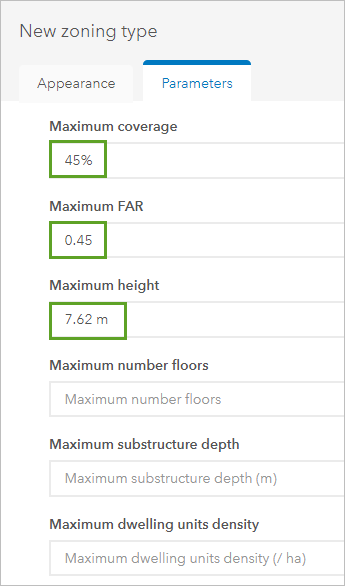
Maximum coverage is the percentage of a parcel that is covered by buildings.
FAR stands for floor area ratio, which is the total amount of floor space compared to the parcel size. A FAR of 0.45 could result in a one-floor building covering 45 percent of the parcel, or could instead result in a three-floor building covering 15 percent of the parcel.
- Leave the other parameters unchanged and click OK.
You have added the Agrarian zoning type individually. Next, you will add the remaining zoning types from a spreadsheet.
- Click Add and choose From spreadsheet.
- Click Choose file, browse to where you saved the spreadsheets, and double-click zoning-types-amsterdam.
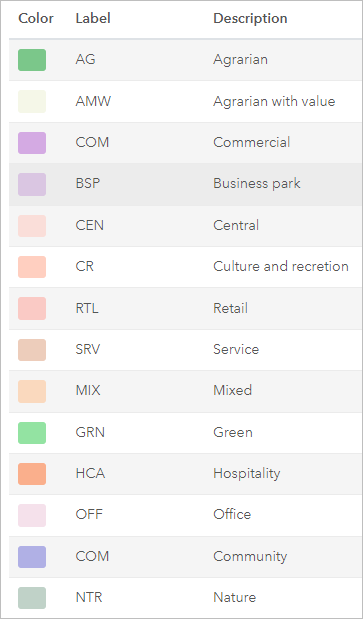
- Fields are matched automatically, so click OK to add the zoning types. Click OK again to close the progress window.
The zoning types with their associated color and description are added. Now that you have added zoning types, you can add a zoning boundaries that will assign each parcel on the map its zoning type.
- On the ribbon, click System of records and click Zoning boundaries.
- For Existing zoning, click Add and verify that you are searching in ArcGIS Online.
- Search for zoning amsterdam owner: Learn_ArcGIS, click the thumbnail for Zoning_Amsterdam_Marktkwartier by Learn_ArcGIS..

Note:
This layer only contains zoning features for the Marktkwartier neighborhood. To add zoning for the whole city of Amsterdam, you can add Zoning Amsterdam. However, uploading the complete zoning layer takes much more time.
- Click OK.
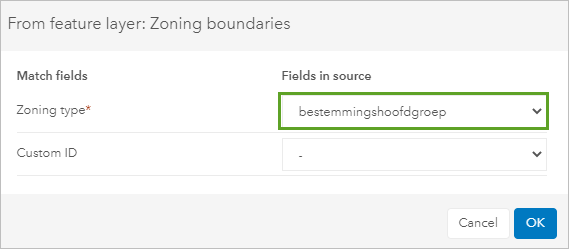
The From feature layer: Zoning boundaries window appears.
- In the From feature layer: Zoning boundaries window, for Fields in source, in the Zoning type row, click the down arrow and click bestemmingshoofdgroep (which means destination group).
- Click OK twice.
Now your model contains all the required information about existing conditions and regulations that you will incorporate into your plans.
Add project status and feedback categories
You have added basemaps, parcels, space use types, building types, zoning features, and zoning types to your urban model. Next, you will add project status types and feedback categories that you will use to label projects according to their status, and to present them for comments. You will also add some buildings manually.
- On the ribbon, click Projects and choose Project status types.
- Click Configure and click Add Status.
- Under Project status, click New status to edit it.
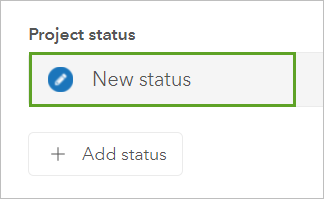
- Set the following project status:
- For Name, type Under review.
- For Icon, click the existing icon, and choose the orange magnifying glass.
- For Description, type The project is currently being reviewed.
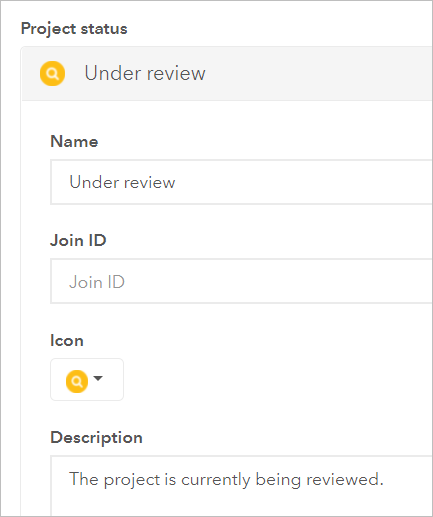
Do not click OK as you will add more project status types.
- Click Add status and click New status. For Name, type Under construction.
- For Icon, click the current icon and click the blue bulldozer icon.
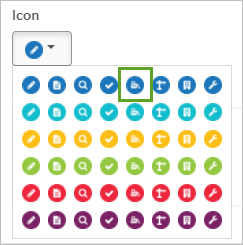
- For Description, type Construction work for the project has started.
- Add another new status named Approved, assign the teal blue check mark as the icon, and for Description, type The project has been approved but construction has not yet begun.
- Add another new status named Complete, assign the green building as the icon, and for Description, type Construction of the project has been completed.
- Click OK.
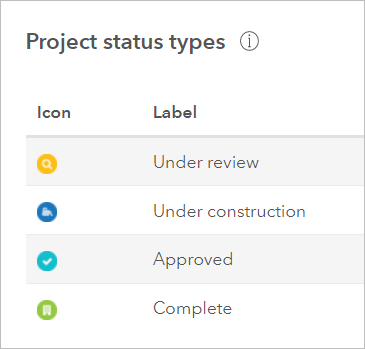
The new project status types are added.
- On the ribbon, click Discussions and choose Feedback categories.
- Click Configure, click Add category, and click New category.
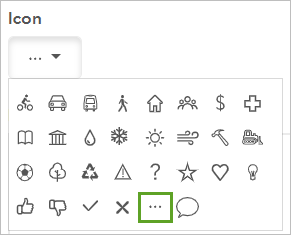
- For Name, type General Feedback and change the Icon to three dots.
- Click OK.
- On the ribbon, click Return to overview icon.

- Zoom in closer to Amsterdam.
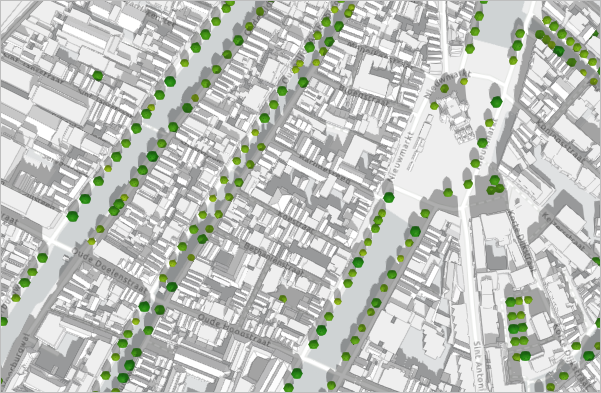
The urban model displays the existing buildings and trees that you added. You also added information on the current planning regulations (space use, buildings, zoning, and parcels) that you will use when you develop your plans. Next, you will start to focus more on climate resilience by adding custom indicators.
Add custom indicators
Next, you will add custom indicators, which will help you assess and compare the effects of your plans. In the case of the Marktkwartier area, the location has already been selected, so you will use custom indicators for site analysis. You will focus on custom indicators for bottlenecks.
Find and upload data
To add custom indicators to the model, you will download the data from the City of Amsterdam and upload it to ArcGIS Online. You will add indicators for bottlenecks and green spaces.
- In a web browser, copy and paste the link to go to the Open Data portal of the City of Amsterdam.
- Click the arrow for Sustainability and click Rainproof – Bottlenecks.
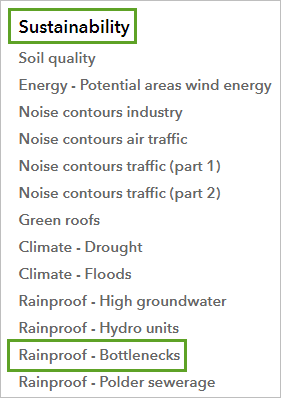
Bottlenecks are areas where water collects and cannot flow away easily, thus creating a risk of flooding. Bottlenecks are a common problem in Amsterdam.
- Next to Download:, click .json (GeoJSON LngLat) >.
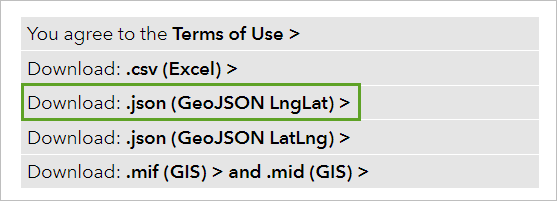
- Right-click anywhere on the page and choose Save as to save the JSON file to your computer.
- In a web browser, open your ArcGIS Online Content page.
- Click New item and choose Your device.
- Browse to the folder where you stored the JSON file, and double-click it.
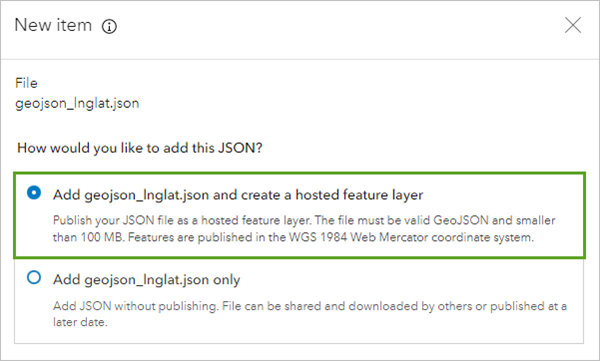
- For How would you like to add this JSON? select Add geojson_lnglat.json and create a hosted feature layer and click Next.
- For Fields, confirm all the fields are selected and click Next.
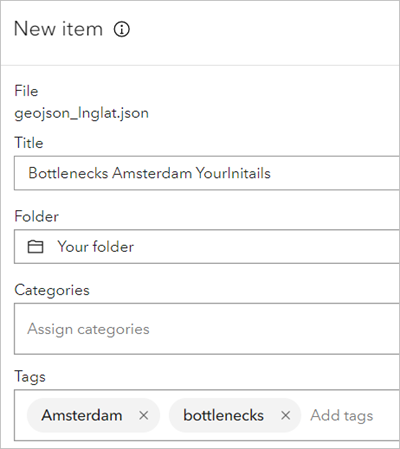
- For Title, type Bottlenecks Amsterdam, followed by your initials.
- For Tags, type Amsterdam and bottlenecks.
- Click Save.
You have successfully downloaded bottlenecks data as a JSON file and added it to ArcGIS Online as a feature layer. Now you can include it in your plans to ensure that you are considering the bottleneck issues while designing your redevelopment scenarios.
Create a web scene
Now that you have added the custom indicator data, you will view it in a web scene. ArcGIS Urban requires data to be in a web scene for adding indicators.
- From the Overview page of the Bottlenecks Amsterdam layer, click Open in Scene Viewer.
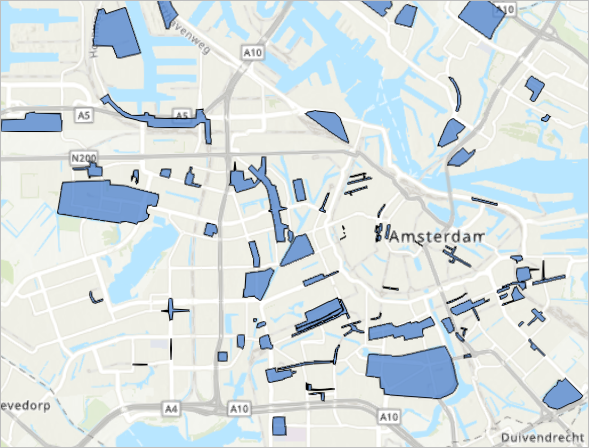
The bottlenecks feature layer appears and the scene automatically zooms to its extent. The layer is symbolized using the same color for every feature. You will modify the symbology to unique values and display the bottlenecks in different colors, based on their severity.
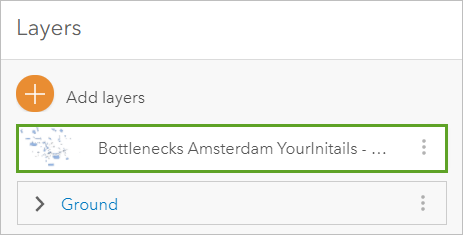
- In the Layers pane, click Bottlenecks Amsterdam.
- For Choose the main attribute to visualize, click the down arrow and choose Prioriteit.
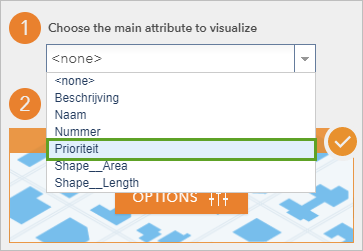
The bottlenecks appear in the scene using the Prioriteit attribute, using a unique value for each priority of bottleneck. You will modify the color for each type, based on the severity, with Urgent being least severe and Extreem urgent being most severe. You will use yellow for least severe, red for most severe, and orange for the middle.
- For Choose a drawing style, for 2D Types, click Options.
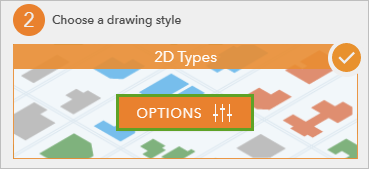
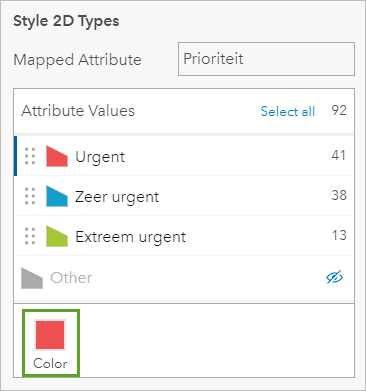
Once you click Options, the color for each type of bottleneck appears. The first type of bottleneck, Urgent, is selected. You can change the color for the selected type by clicking the Color icon.
- Under the legend for the various types of bottlenecks, click Color for the selected Urgent symbol.
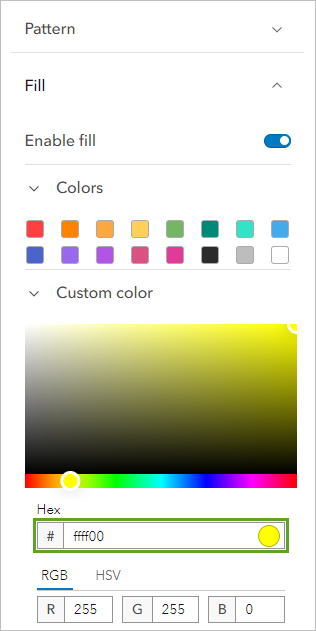
- In color pane, expand Custom color and for Hex type #ffff00 and press Enter to set the color to yellow.
- Click DONE.
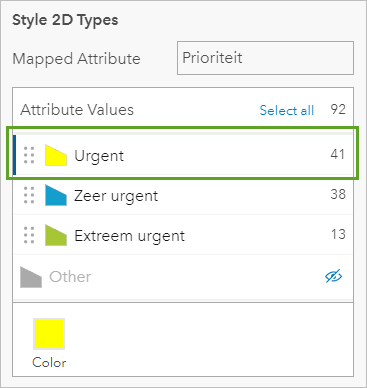
Urgent bottlenecks will now appear in yellow. Next, you will set the colors for the other two values.
- Change the Color for Zeer urgent to #ffaa00.
- Change the Color for Extreem urgent to #ff0000.
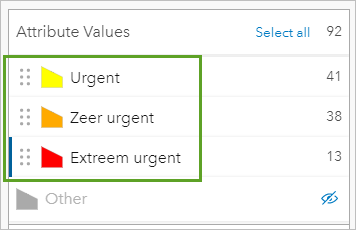
Now the symbols match the severity of the bottlenecks, which simplifies the interpretation of the bottleneck data.
- Click Done two times, as you are finished modifying the layer.
- In the Designer (dark) toolbar, click the Save button.
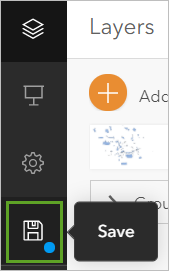
The Save scene window appears.
- In the Save scene window, enter the following:
- For Title, type Bottlenecks Amsterdam, followed by your initials.
- For Summary, type Bottlenecks in Amsterdam displayed by severity.
- For Tags, type Amsterdam and ArcGIS Urban.
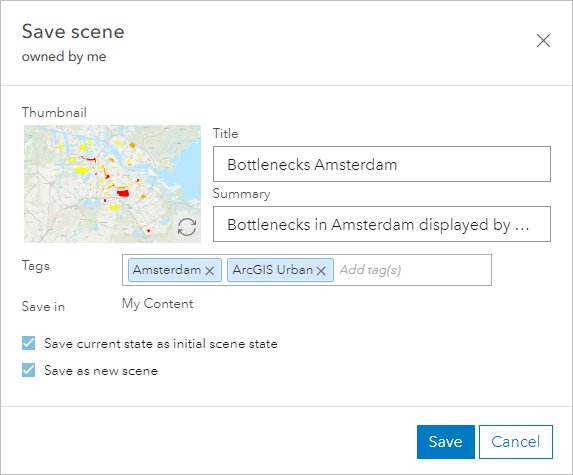
- Click Save.
- On the ribbon, click Home and choose Content to see the new scene item in your content.

You have created a web scene and modified the symbology for the types of bottlenecks. Next, you will add the bottlenecks layer to the urban model so that you can visualize bottlenecks in relation to your scenarios.
Upload an indicator
Next, you will upload the bottlenecks indicator to your urban model.
- In the Content pane, from the list of items, click Amsterdam Urban Model to open the Overview page.
- On the Overview page, click Open in ArcGIS Urban.
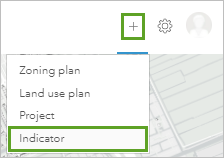
- On the ribbon, click Add and choose Indicator.
- On the Indicator settings window, for Name, type Bottlenecks.
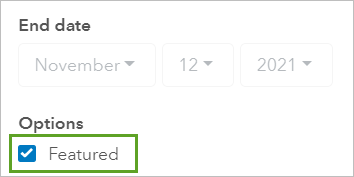
- In the Options section, check the check box for Featured.
- Click the Sources tab.
- In the External layers section, click the edit button.

Note:
The bottlenecks layer is the only option for external layers, as Urban automatically filters the items from your content that are applicable to add as an external layer for the indicator.
- Click the thumbnail for Bottlenecks Amsterdam and click OK two times.
Note:
If the model does not automatically zoom to the Bottlenecks layer, click the Zoom To button in the pane.
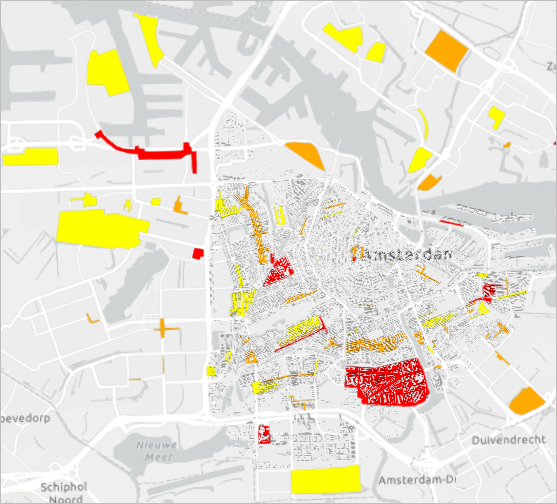
- Zoom to the Marktkwartier neighborhood, near the northwest corner of the area.
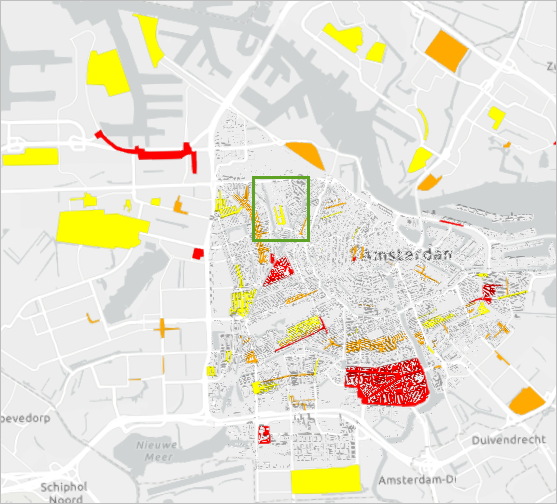
The Marktkwartier neighborhood is bordered by canals to the east and the west, and has a yellow, or low-priority bottleneck in its center. This is an important problem to consider in your plans.
Some other valuable indicators that you can add are Climate-Floods and Green Roofs, also from the City of Amsterdam Maps Data page. The more indicators you add, the more information you will have available to you about your area of interest.
You have created custom indicators, which will help you evaluate your plans to verify that they achieve their goals. Next, you will create a project and plans, while considering the bottleneck problem and trying to solve it.
Create a project and scenarios
Projects are short-term or smaller-scale developments on a parcel or group of parcels. Urban allows you to create a detailed 3D model of the project, or to import preexisting ones. When creating or editing a project, you can propose different scenarios and compare them. Comparing different scenarios gives planners the opportunity to explore and compare future options, set different targets, and see what the compromises to reach targets will be. This process is called backcasting and is quite common in urban planning.
Create a project
You will create a project in the Marktkwartier neighborhood with the intent of adding new housing units. This is a key target for the city of Amsterdam because the housing shortage is an important issue that planners must address. While considering the housing shortage, the project must also be livable and sustainable.
- In the Amsterdam urban model, zoom in to the Marktkwartier area.
- On the ribbon, click Add and choose Project.
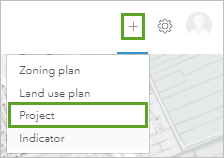
The Create project pane appears so that you can enter information about the new project. First you will define an area.
- Draw a polygon around the area of the project by clicking once to add a vertex to set corners or change direction. Double-click the final vertex to finish the project.
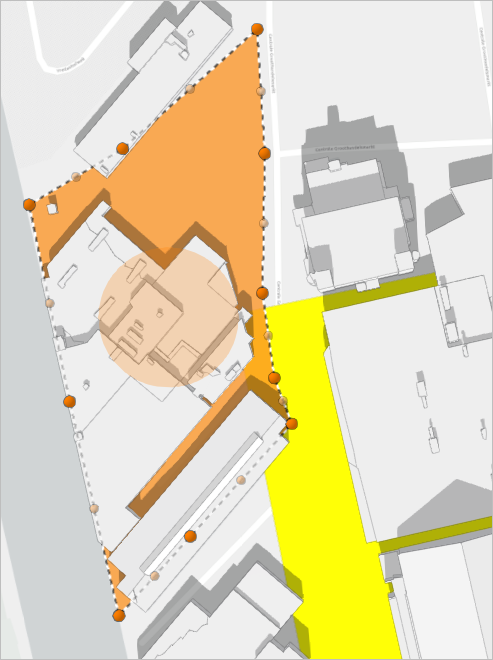
- On the Create Project pane, for Name, type Marktkwartier project and click OK to create a project.
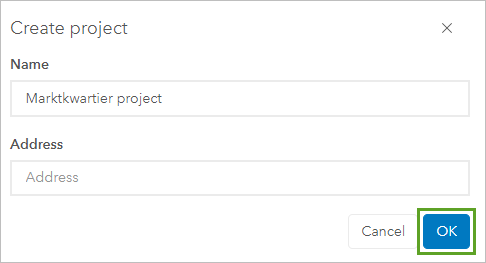
The new project is set up and you can adding more detailed configurations to it.
- On the ribbon, click on Marktkwartier project and click on Configure project.
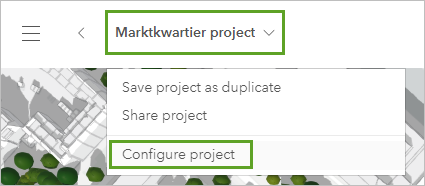
The Detail card window appears. You will add details about the project you created.
- In the Detail card window, set the following properties:
- For Description, type or copy and paste Short-term development for new housing units in the Marktkwartier neighborhood in Amsterdam.
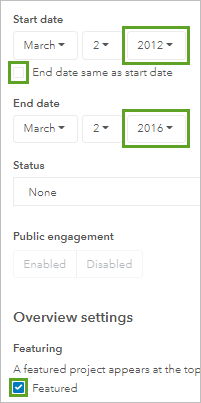
- For Start Date, change the year to 2012 and uncheck End date same as start date.
- For End Date, change the year to 2016.
- Under Options, check Featured.
- On the ribbon, click Dashboards, in the drop-down menu choose Metrics.

You will use metrics to quantify and analyze scenarios and compare them with each other.
- Click on the Add button.
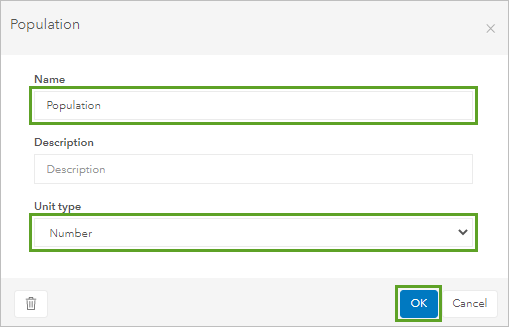
- In the New metric window, for name type Population and for Unit type select Number. Click OK.
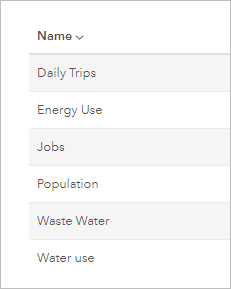
- Similarly add the following metrics to the list and set the Unit type to Number for all:
- Jobs
- Daily Trips
- Energy Use
- Water Use
- Waste
- On the ribbon, click the Return to project icon.
Next, you will edit the project. You will create two development scenarios for the area that you identified for comparison.
Build the first scenario
Now that you have created a project, you will edit the first scenario. In this scenario, you will keep things simple and create two large housing buildings.
- Under the map area, on the toolbar, click Demolish.

- Click Use Study Area to demolish all existing buildings within the designated area.
Demolishing the existing parcels provides a clean area, with no parcels, so that you can build your scenario.
Note:
All buildings remain in the existing conditions, so it is important to modify the scenarios and not the existing conditions.
- Under the map area, on the toolbar, click Buildings.
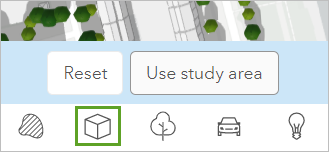
- For Height of new building, type 20 and click New Building.

- Draw a new building by clicking once to add corners and double-clicking to finish the building.
- Click + New Building.
- Draw another building within the boundary.
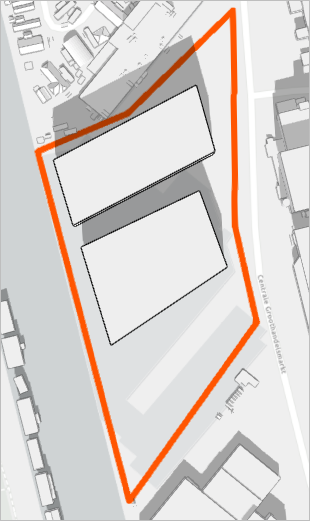
Note:
Your buildings will be different, but that is OK.
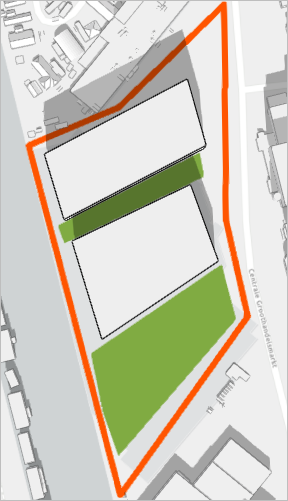
You have added two buildings to the first scenario. In the real world, a parcel may contain elements, such as a parking lot or a row of shrubs, or a water feature. Urban contains tools to create many elements to further enable planners to create a realistic project. From the same toolbar in which you added buildings, you can add ground features, such as grass, water, and concrete, and choose from many types of trees, vehicles, and street furniture.
- Under the map area, on the toolbar, click Ground and click Grass.
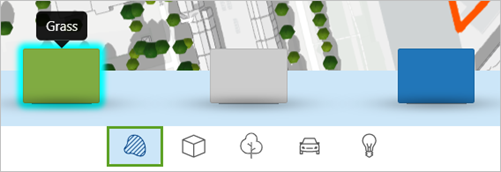
- In the same way in which you drew the buildings, draw some grass areas.
- On the toolbar, click Concrete.
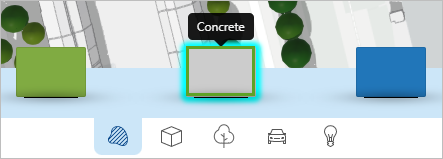
- Draw some Concrete for parking spots.
- Experiment with the other tools and add decorative elements, such as water, trees, or street furniture.
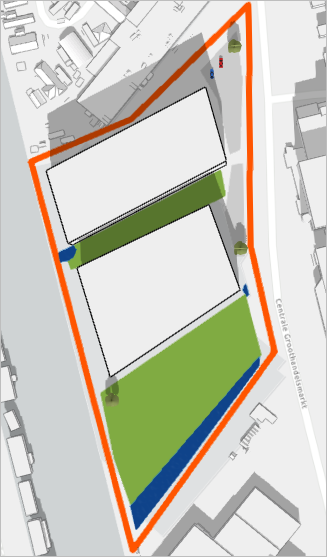
Now the first scenario is ready. This is only a schematic representation, but it gives a good indication of how the project will look in the rest of the urban environment. Next, you will configure the project by adding the new capacity indicators.
- On the ribbon, click on the Dashboards icon.
A list of the metrics you created in the previous section appears. You will enter information regarding the metrics for the scenario. Entering the metrics is not mandatory, but it is a useful step in the planning process. The numbers you add now will later be visible in the overview of the project, and they will be a quick way to gain more information about the project. This data is useful to determine whether the project is reaching the target and what compromises must be made to reach the target. For example, a large and tall building can accommodate more households, but it will also produce more CO2.
The figures that you will use for the metrics are not exact numbers but only approximations made from the information available to you. If you were a planner working for the municipality, or for a construction company, you would have access to more precise information.
- On the Dashboard pane click on Edit dashboard icon.
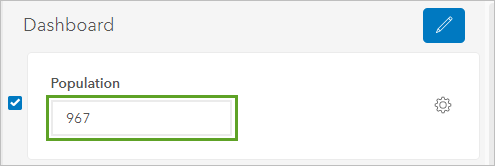
- For Population, type 967 and press Enter.
- Similarly, type the following values for each parameter:
- Jobs: 0.
- Daily Trips: 450
- Energy Use: 3,600.
- Water Use: 103,469.
- Waste: 194,172.
Note:
The information provided for new capacity indicators was obtained from Statistics Netherlands.
- When you are done, click on the pencil icon.
You see a list on the metric values for Scenario 1 that you set.
Now the first scenario is ready. Next, you will create an alternate redevelopment scenario for comparison.
Build a second scenario
Having more than one scenario is valuable so that you can visualize how each scenario is similar or different, and determine which is the more optimal scenario for your project. In the same way in which you added scenario 1, you will add another scenario to the project.
- On the ribbon, click Configure scenarios.

The Scenarios pane appears. By default, a project has two scenarios: the existing conditions and the new (future) conditions. You will create a second scenario.
- In the Scenarios pane, click Add scenario.
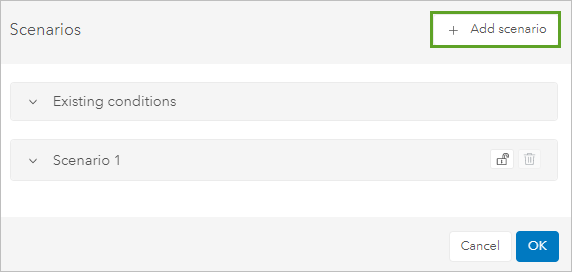
Add design scenario window appears.
- For Scenario name, type Scenario 2. For Based on leave the default Existing Conditions and click OK twice.
- On the ribbon, make sure Scenario 2 is the active tab to start editing it.

You will make the second scenario different from the first scenario by including many smaller, individual housing units.
- Under the map area, on the toolbar, click Demolish. Click Use Study Area to demolish the buildings.
Note:
For this lesson, the area used is all old warehouses, so no one is affected by demolishing. In any instance, it is important to know who and what you are removing when redesigning any space.
- On the toolbar, click Buildings.
- For Height of new building, type 6 and click New Building.
- Draw several smaller buildings around the perimeter, clicking New Building after you complete each building.
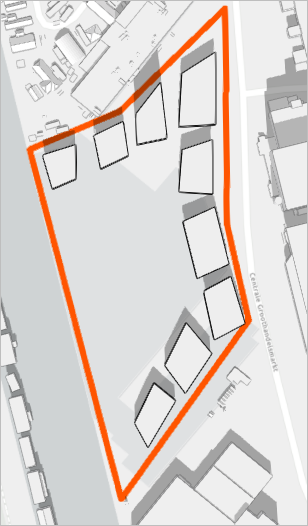
- Draw grass and some other elements, such as water and trees, in the scenario.
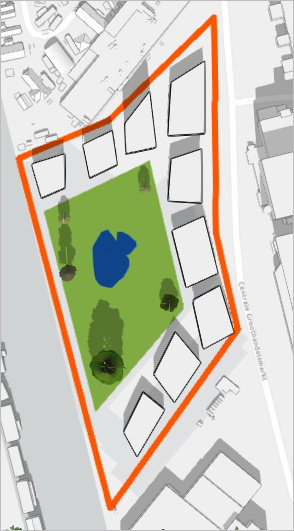
You will set the metrics for the scenario.
- On the ribbon, click the Dashboards icon.

- Click on the pencil icon to edit the dashboard.
- For Population, type 71 and press Enter.
- Similarly, type the following values for each parameter:
- Jobs: 0.
- Daily Trips: 71
- Energy Use: 271.
- Water Use: 8.
- Waste: 14251.
- Click the pencil icon to exit the edit mode.
- On the ribbon, click Return to overview icon.
Both scenarios in the project are complete. The first scenario offers more housing units and the top of the two large buildings could become green roofs, thus making the buildings more sustainable. However, the space between the buildings is small, and so many housing units would require a larger area for parking. A solution could be to incorporate underground parking, but this would increase the building costs. The second scenario offers fewer households, is more spread out, and contains green areas. The second scenario may be a nicer place to live, but this also means that the prices could be higher. Both scenarios have their pros and cons, therefore it is up to the planner to evaluate them and decide which is more suitable to the initial targets.
When creating scenarios, the goal is to be creative with the design. Here is another example of a project that you can try to re-create:
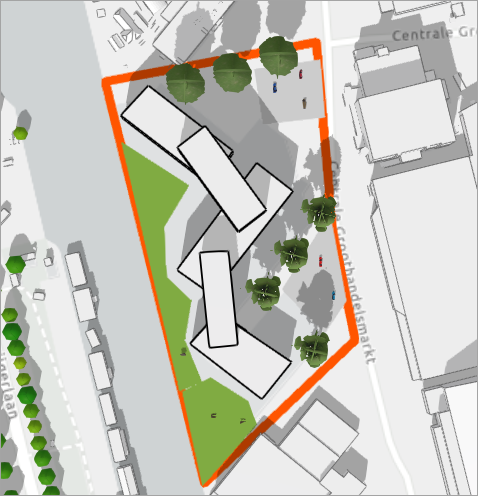
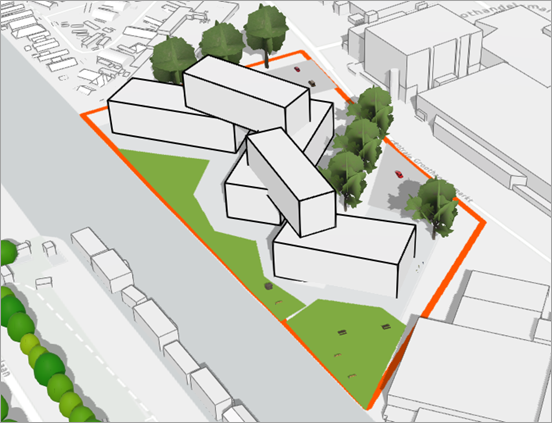
You have constructed two redevelopment scenarios for the study area that you can compare against the requirements. Next, you will look at plans to propose long-term developments.
Create a zoning plan
Plans in Urban are like projects, in that they also allow you to design and compare different scenarios. However, plans are for long-term developments over a larger area. There are two types of plans: land use and zoning plans. Land use plans allow planners to propose future land use over large areas. Zoning plans usually concern smaller areas and consider zoning regulations. Planners can propose scenarios that consider the existing regulations, or they can alter the existing regulations and propose new ones.
Set up a new zoning plan
You will create a zoning plan for the Marktkwartier neighborhood with the intent of creating a new residential neighborhood, while also making the area more climate proof.
- On the ribbon, click Add and choose Zoning Plan.
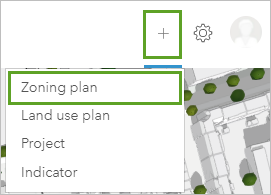
The Marktkwartier plan is an actual plan developed by the municipality of Amsterdam, in collaboration with a private development company. You will use this plan as an example. The data or the proposed changes that you will develop are not to be considered an exact replica of real-life development.
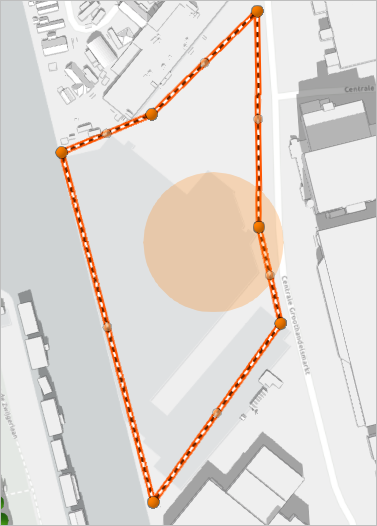
- Draw the following boundary as the area for the plan. When you add the last point double click to finish.
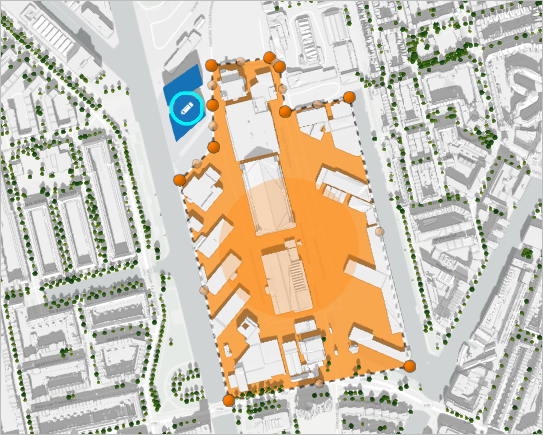
- On the Create zoning plan pane, for Name, type Marktkwartier zoning plan and click OK.
- On the ribbon, click on Marktkwartier zoning plan and click Configure plan.
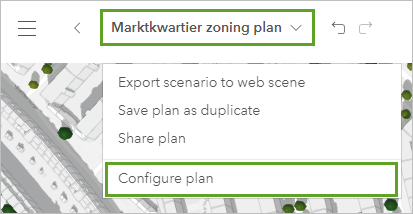
- On the Detail card window, enter the following:
- For Description, type Urban master plan for a new residential neighborhood with ca. 1700 units, total area 200,000 m2.
- For Start Date, set the year to 2012.
- Uncheck End date same as start date.
- For End Date, set the year to 2023.
- Under Overview settings, for Featuring, check Featured.
- On the ribbon, click on the Return to plan icon.
The new zoning plan is added. Before you modify and split the zoning for the Marktkwartier area, you will analyze the plan to see the current zoning allocation. You will keep the existing conditions, and work on scenario 1. First, you will observe the existing zoning allocation within the study area
- On the ribbon, click on the Zoning tab.
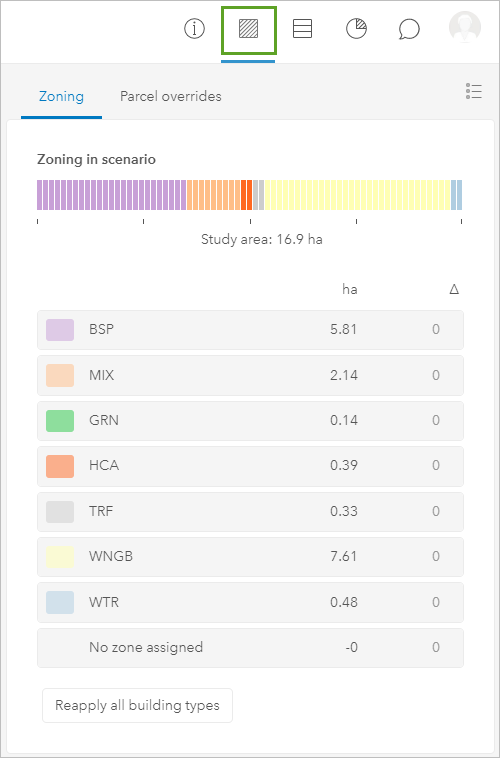
Note:
Your values might differ from the above image
Notice that most of the area is already residential zoning (WNGB), but a large part of it is also zoned Business Park (BSP). Because much of the area is zoned as business park, you must change it to a zoning type that can include residential buildings. You also will change the central area into a green space, which will address the bottleneck problem because vegetation absorbs and stores rainwater better than concrete. Vegetation also diminishes the heat island effect, thus making the area less hot and more livable. For the rest of the area, you will try to maintain the existing regulations.
Edit the zoning
Next, you will create a zoning type that can host a mix of residential and retail and modify the business park zones to this new zoning type. This updated zoning plan will align well with the redevelopment plan of the Marktkwartier area.
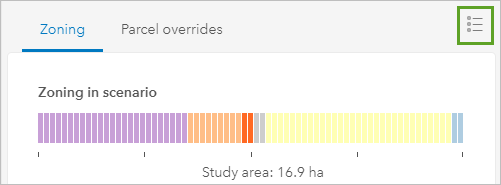
- In the Zoning pane, click on the Zoning types button.
- In the Zoning types pane, click the Add button to create a zoning type.
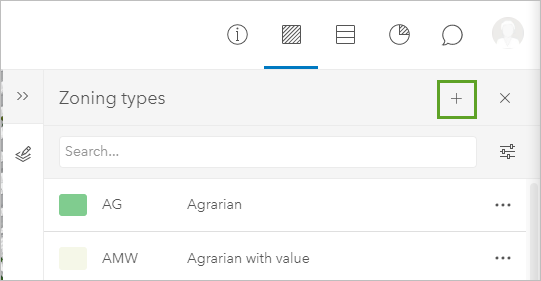
- On the New zoning type window, for Label, type MIX-1.
- For Description, type Residential and retail.
- For Color, type #db678b.
- On the Parameters tab, for Maximum height, type 30.
Note:
This is a hypothetical case used to show how to create a zoning type and set properties. In real-world situations, the more precise parameters are, the better the model will work.
- Leave all remaining parameters empty and click OK.
- On the map, click the northernmost zoning polygon in the Marktkwartier area to select it. Be sure not to click any buildings because you only want the zone selected.
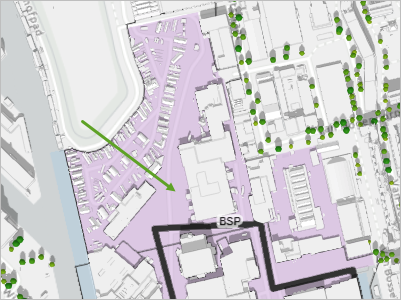
The zoning polygon is selected.
- In the pop-up window, click Modify.
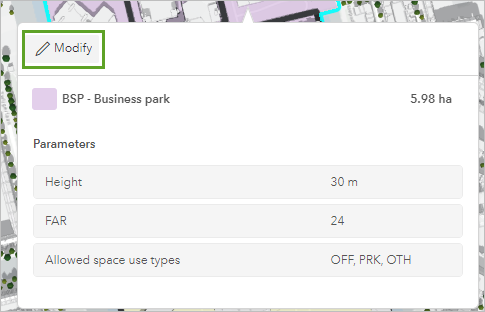
- In the Modify zoning window, click on the drop down arrow and select MIX-1 from the list to set it as the zoning type for the selected zones. Uncheck Merge adjacent boundaries of the same type.
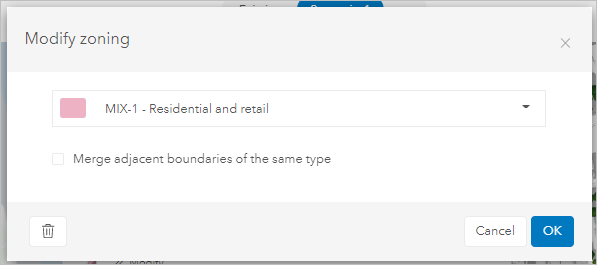
- Click OK.
- Similarly change all the BSP zones to MIX-1 in the Marktkwartier area. Click outside of any zones (in the road) to clear the selection.
The MIX-1 zoning type is now assigned to the zones that you selected and they are symbolized accordingly.
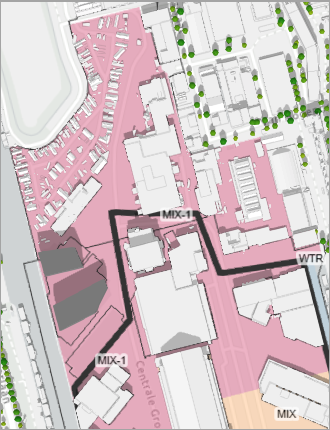
Next, you will modify another zone and split it to add green space to help with bottlenecks and residual heat.
- Click and change each of the southernmost zone and the MIX zone just north of it to MIX-1 as the zoning type.
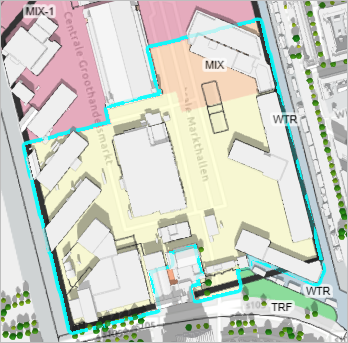
The zoning polygons in the map update to the MIX-1 symbol. You have modified all the zoning to accommodate a mix of residential and retail.
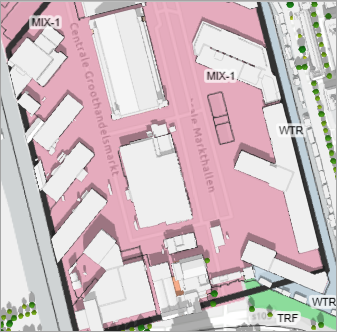
Next, you will split the southern zone to add green spaces.
- On the vertical toolbar next to the map, click Add boundary.
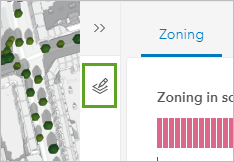
- On the horizontal toolbar above the map, click the drop down arrow for zoning type and choose GRN - green.

- Draw a polygon to split the zone into a green zone. Double click to finish the polygon
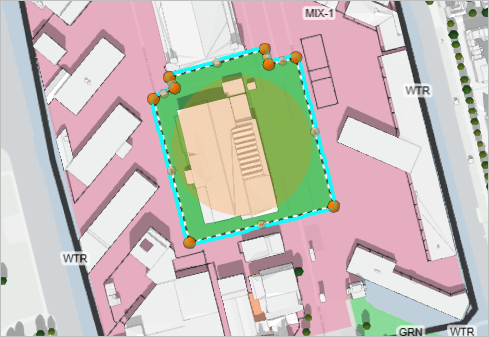
- On the toolbar above the map, click OK.
You see that a green zone type has replaced the previously chosen mixed zone.
- Following steps 14 to 17, you will add another green zone type north of the newly added green zone.
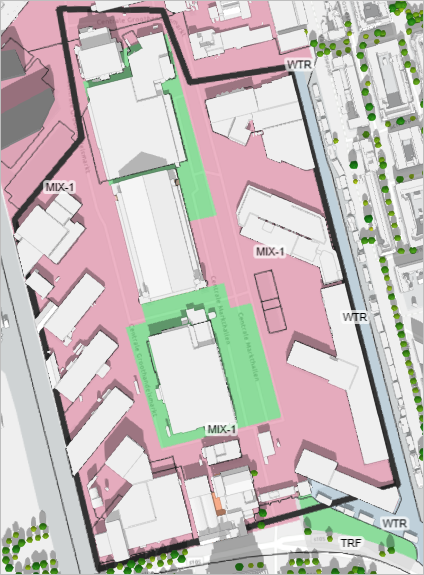
To plan a climate-friendly redevelopment of the Marktkwartier area, you have changed the zoning, split existing zoning polygons, and set them to nature to account for green space. Now that the zoning regulations are adjusted to the purpose of the plan, you can start to develop new buildings.
Develop new buildings
You will now develop new buildings with the intent of creating more housing units, but also to provide some facilities to make the area nicer to live in. You will select the parcels containing the buildings that are in the newly proposed green spaces and demolish them.
- On the ribbon, click the Development tab.
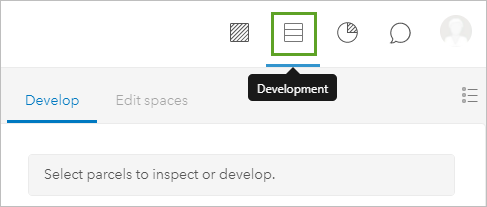
- In the southernmost green space, select the parcels to demolish by holding the Shift key and selecting multiple parcels.
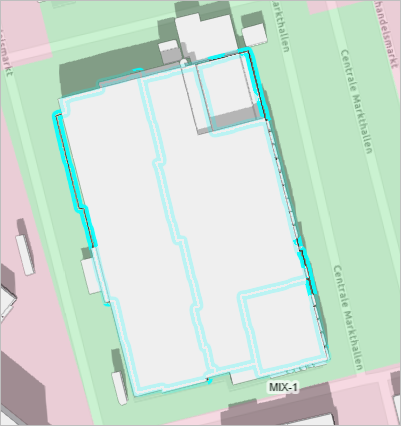
- On the keyboard, press the C key and pan to the northern green area, if necessary.
- Press the Shift key and select the parcels in the northern green area.
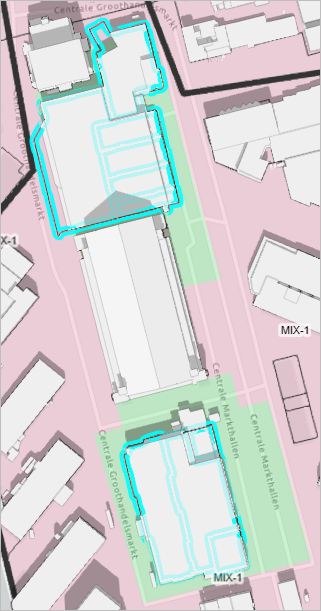
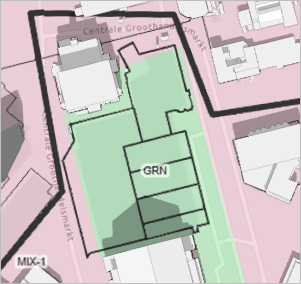
Now you have all the parcels within the designated green spaces selected. Since these areas proposed green spaces, you will demolish the parcels and associated buildings so that you can more accurately visualize the scenarios.
- On the Develop tab, click Modify and click Demolish.
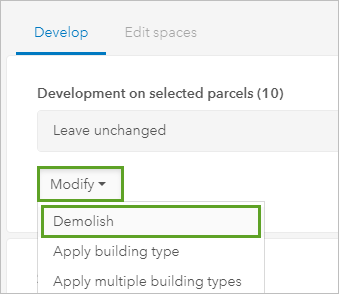
- Click anywhere on the map to unselect the features.
Note:
It is OK if you cannot select and demolish all the smaller buildings.
The parcels in the green spaces are demolished. By leaving the green areas free of buildings, planners could allocate the space for a communal park or garden. You will leave the building in between the green areas as it is to preserve some of the historical buildings in the neighbourhood. The inside of the historical building could still be used for market purposes or for community activities. You will continue developing your scenario by modifying more parcels.
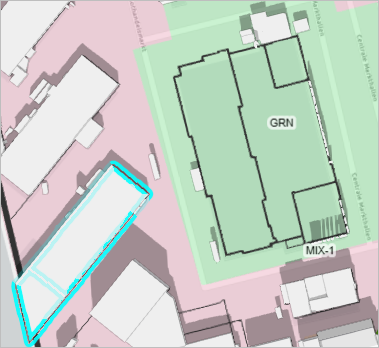
- Select the two parcels to the west of the southern green area.
- On the Develop tab, click Modify and in the drop-down menu click Apply building type.
- From the list of building types, choose Low-Rise Residential. Click a road to clear the selection.
The parcel is modified and symbolized as Low-Rise-Residential. You will continue to develop more parcels by merging existing adjacent parcels into one.
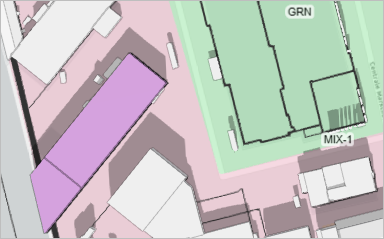
- To the north of the new low-rise residential parcel, skip the next parcel, then select the next two parcels.
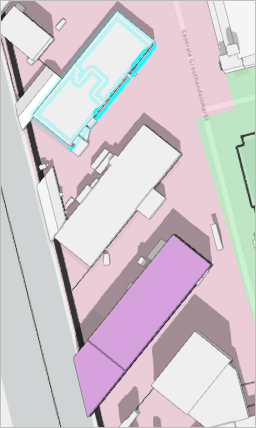
- On the vertical toolbar next to the map, click Edit geometry and click Merge.
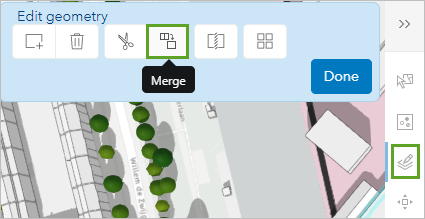
- In the Merge selection message, click Merge to confirm the operation and click Done.
The two parcels are now merged into one. Now that you have one parcel, you will set its type to Low-Rise Residential.
- If necessary, select the new parcel you created and the one south of it and click Modify and click Apply building type.
- Set the building type to Low-Rise Residential and clear the selection.
All the parcels along the western side of the study area are now set to accommodate low-rise residential buildings. You will continue developing the study area by splitting existing parcels and setting their building type.
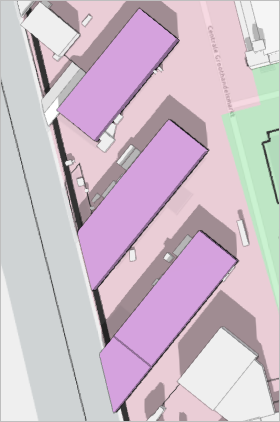
- Select the parcel on the eastern side of the southern green area.
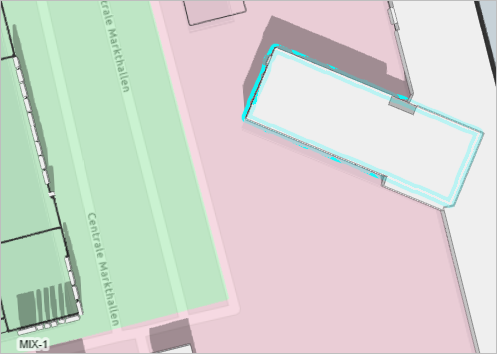
This parcel is not in an ideal position for a building since it would block the other buildings behind it, so you will use the split tool to divide it into smaller parts.
- On the vertical toolbar next to the map, click the Edit geometry tool, and choose Split.
- Draw a line that cuts across the parcel, double click to finish the line.
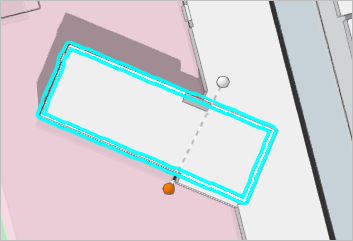
- Click OK and click Done.
- Select only the parcel on the left of where you split it.
- In the Develop tab, click Modify and click Demolish.
- Select all the parcels along the eastern edge of the area, by holding the Shift key and clicking parcels.
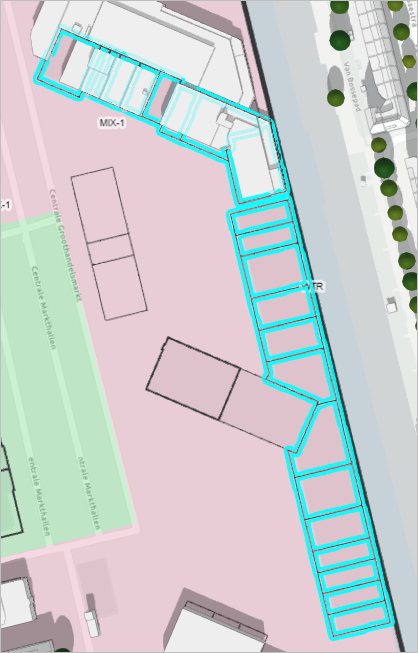
- In the Develop pane, click Modify and choose Apply building type. In the list select Low-Rise Residential.
The scenario is looking great. You will set other parcels as offices, retail, and hotels to complete the scenario.
- Select the parcels just north of the new low-rise residential buildings you just modified.
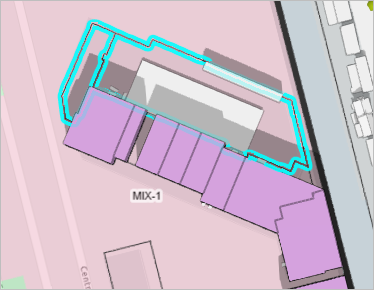
- In the Develop pane, click Modify and choose Apply building type. In the list select Mid-Rise Residential w/ Office.
- To the north of the parcels you just modified, select some and modify them to Retail Urban Department Store, and select others and modify them to Mid-Rise Hotel.
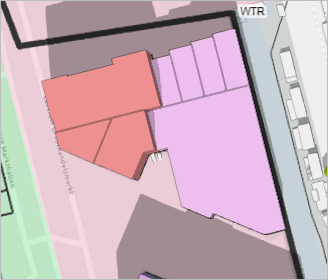
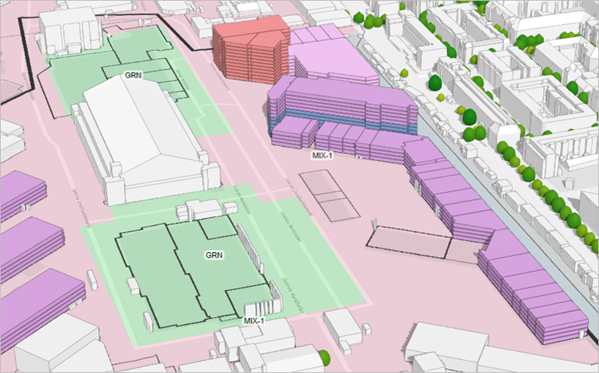
The mid-rise buildings appear the same as the low-rise buildings, but they are actually taller. You cannot tell the difference when viewing the model in 2D. When you view the model in 3D, you will see the height difference.
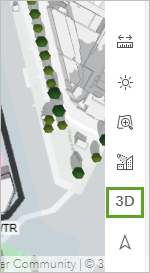
- On the vertical toolbar next to the map, click 3D and experiment with tilting the view.
After about an hour of work, your plan is looking great and contains green space and a mixture of building types that comply with the redevelopment standards. You have built a viable plan, while maintaining the green spaces, which are important for the community life of the neighborhood, but also for increasing climate resilience.
Analyze the plan
Once you are done developing the plan, it is important to analyze the changes that you are proposing. You can analyze the types of zoning, space use, and capacity indicators for your proposed development plan.
- On the ribbon, click the Zoning tab.
Note:
The values you explore for zoning, space use types, and capacity indicators may differ from your values.
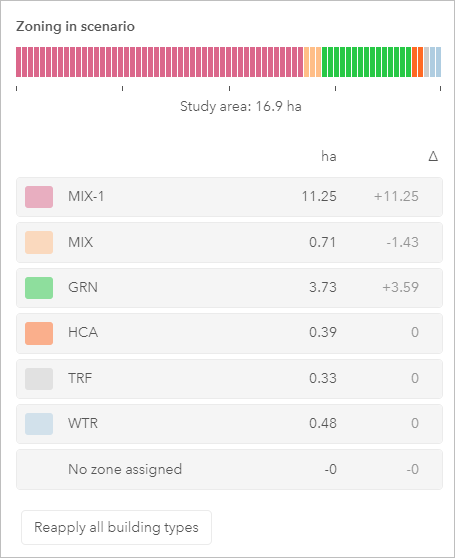
The proportions of the different zoning types in the scenario appear. You can see the proportions of the new MIX-1 zoning type and the GRN zoning type that you set in two different areas. Here, you can analyze how much of each zoning type there are. For example, you may have to include a specified amount of green space in an area and you can check the proportions here.
- Click the Development tab and click Space Use.
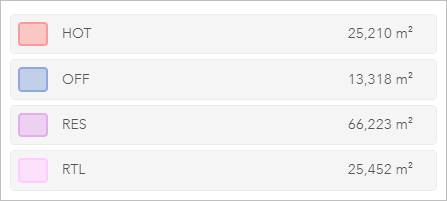
The proportions of the different space use types in the scenario appear. Next you will configure metrics for the plan.
Add metrics to the plan
Metrics help to quantify and analyze scenarios and compare them. In this section you will be creating metrics which you will use later when you create plans.
- On the ribbon, click the Dashboard tab and click Configure metrics.
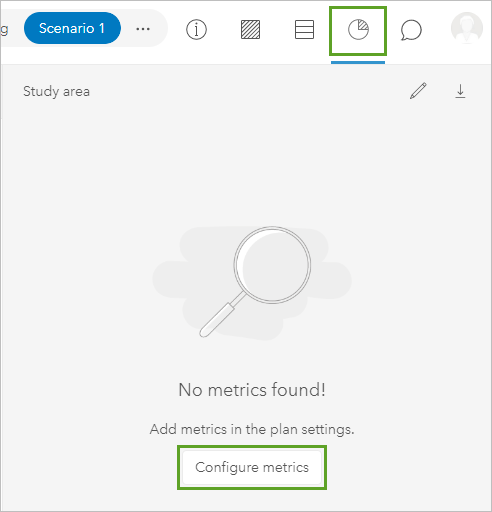
The Dashboard tab opens.
When you create a plan, metrics are copied from your urban model. If there are existing metric values, they are also copied. Since you did not create any metrics at the beginning of the lesson you will configure new metrics.
- On the ribbon, click Dashboard and choose Metrics.

When you create a plan, metrics are copied from your urban model. If there are existing metric values, they are also copied. In the plan editor, you can configure new metrics, edit metrics, and add existing values to metrics that reflect the current conditions.
- Click the Add button

The New metric window appears.
- In the New metric window, set the following parameters:
- For Name, type Population.
- For Description, type Capacity for number of people.
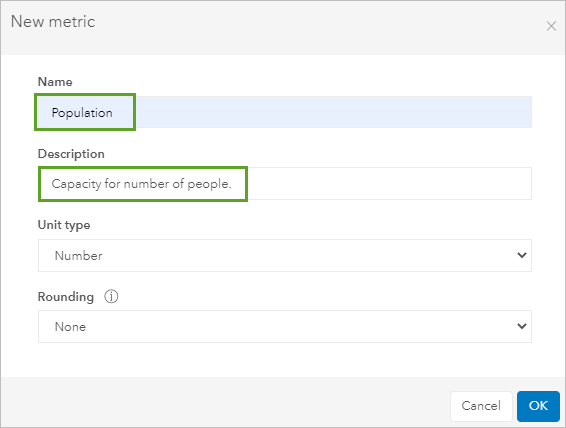
- On the header, click OK.
The Population metric is added as a metric.
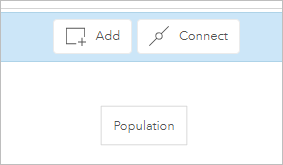
- Following steps 4 to 6, add the following metrics:
Name Description Jobs
Capacity for number of jobs.
Energy Use
Energy use per day generated from population and jobs.
Daily trips
Daily trips per day generated from population, jobs and space area.
Water use
Water use per day generated from population and jobs.
Waste
Solid and water waste per day generated from population and jobs.

Next, you will connect these metrics. By connecting two metrics, you can use one metric as a source in another metric. Metric sources are aggregated as a weighted sum and summed up to the metric value.
- On the header, click on Connect.
The Connect window appears.
- In the Connect window, create a connection from Net space area to Population and click OK.
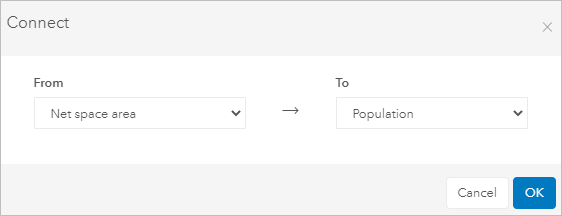
- Following steps 8 to 9, add the following connections:
From To Net space area
Jobs
Population
Energy Use
Population
Daily trips
Population
Water use
Population
Waste
Jobs
Energy Use
Jobs
Daily trips
Jobs
Water use
Jobs
Waste
You see a connection graph of the metric being created as you add each of the metrics listed.
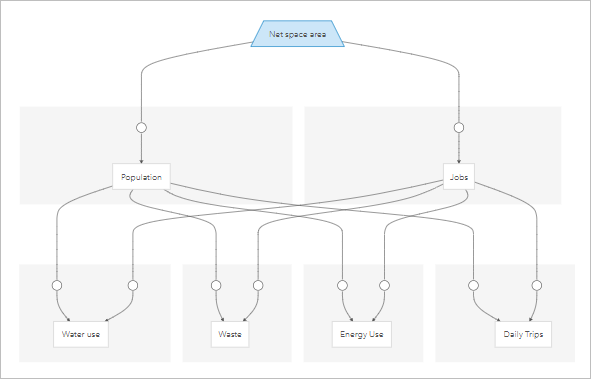
Next, you will change the weight type of the source metric value to Space use type parameter.
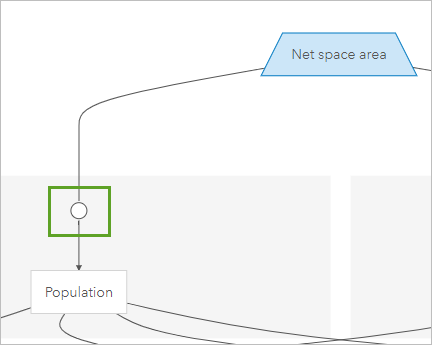
- Click the Edit connection button between Net space area and Population.
- In the Edit connection window, set the following:
- For Weighting choose Space use type parameter.
- For Parameter, click on x (multiplication) and change it to / (division). Replace Parameter name to Area per person.
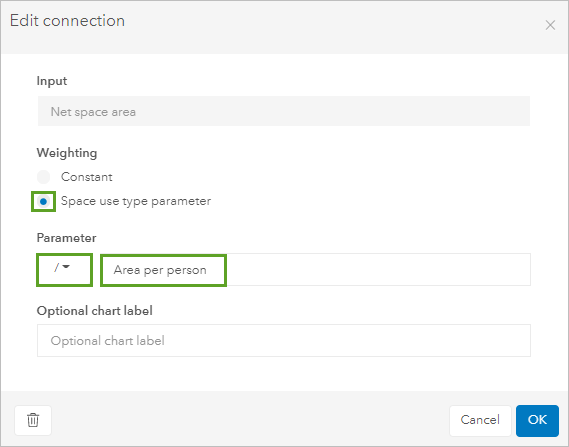
- Click OK.
- Similarly, click the Edit connection button between Net space area and Jobs.
- In the Edit connection window, set the following:
- For Weighting choose Space use type parameter.
- For Parameter, click on x and change it to /. Replace Parameter name to Area per job.
- Click OK.
Next, you will set the weighting for the remaining metrics.
- Click the Edit connection button between Population and Water use connection.
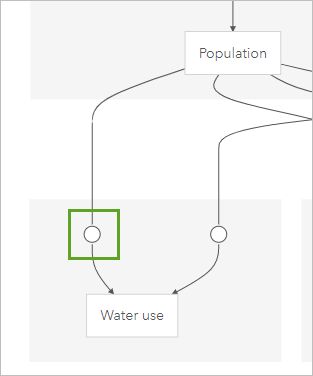
The Edit connection window appears.
- In the Edit connection window, for Weighting choose Space use type parameter and click OK.
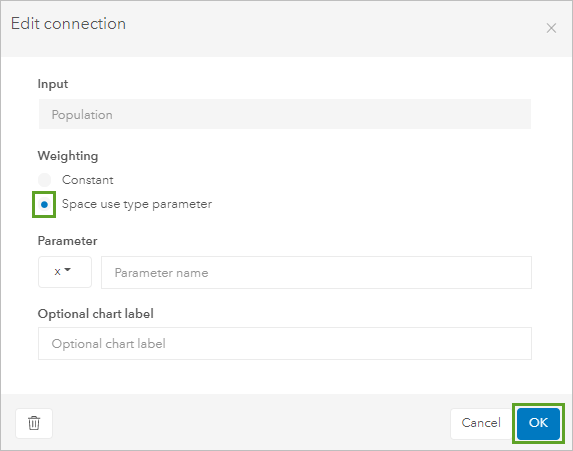
For Parameter you will leave the default in this case which is multiplication.
- Change the Weighting for all the remaining connection to Space use type parameter.
Next, you will add space use types and building types to your urban model.
- On the ribbon, click on Development and choose Space use types.
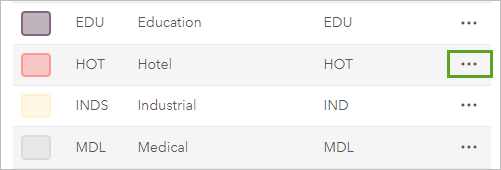
Previously, you seen that the space use types for the plan were Hotel (HOT), Housing (RES), Retail (RTL) and Office (OFF). You will add metric parameters to these for demonstration purposes. You can add metrics for the other space use type as well.
- In the Space use types list, for HOT click on options.
- In the Metric parameters tab, set the following values:
- For Daily Trips, set Population to 0 and Jobs as 1.
- For Energy Use, set Population to 0 and Jobs as 66.077.
- For Waste, set Population to 0 and Jobs as 787.828.
- For Water use, set Population to 0 and Jobs as 1277.846.
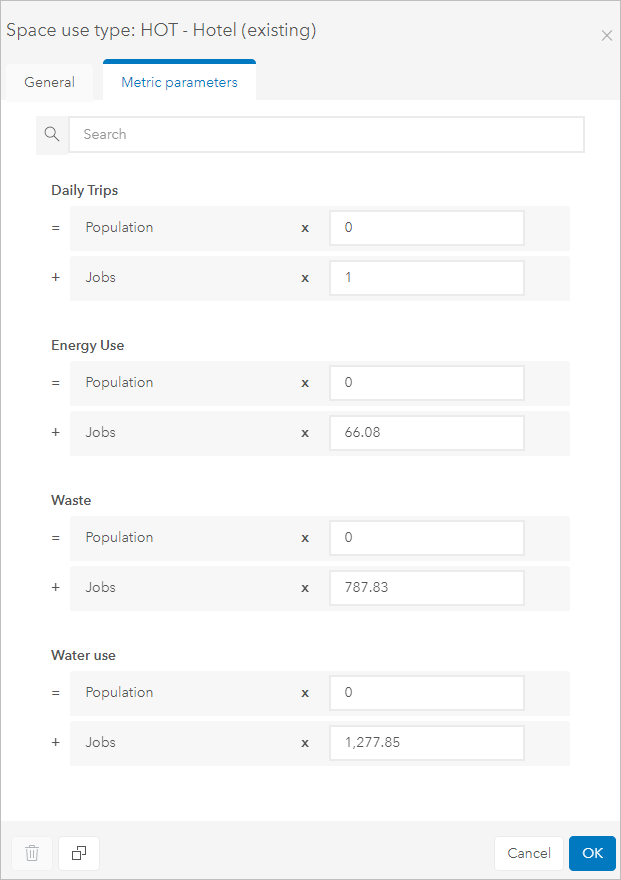
- Click OK and in the Modify existing window, click Yes to continue.
- Similarly, add the metric values for the remaining space use type as per the table:
Space use type Metric Parameter Population Jobs Office (OFF)
Daily Trips
0
1
Energy Use
0
18.741
Water use
0
87.181
Waste
0
59.303
Housing (RES)
Daily Trips
0
1
Energy Use
61.912
0
Water use
314.189
0
Waste
194.851
0
Retail (RTL)
Daily Trips
0
1
Energy Use
0
71.442
Water use
0
247.133
Waste
0
152.909
- On the ribbon, click on Return to Plan icon.
- On the Marktkwartier zone plan, click on the Dashboards button to view the metrics.
- On the Study area pane, click on the Edit dashboard button and uncheck Population and Jobs.
- Click on the Edit dashboard icon again.
Here you can see the metrics and the changes that the proposed developments would imply. For each metric, you can set the target that you wanted to achieve so that you can see if the target was reached. Metrics are a valuable part of this process, as they provide an overview of the changes over time that every proposed scenario would imply.
As you can see, the scenario you developed does not reach the target yet, thus you might still want to work on it to reach the target. Unfortunately, these indicators do not tell you much about the other goal: climate-proofing the neighborhood; but you addressed the bottleneck problem by adding two green areas in the center.
Note:
To compare all the metrics in a table, in the Study area pane click Download to download a spreadsheet.
Are you happy with the results you achieved? If not, you can always go back to editing the plan. Remember that achieving a certain target always implies compromising other factors. For example, creating many households could lead to having an overly dense neighborhood without any green space or with buildings that are too high for the existing regulations. Presenting and comparing different scenarios can again be helpful for evaluating the costs and benefits of proposed developments.
Publish the plan
Next, you will publish the plan so it is available to the public. Publishing to the public allows those without an ArcGIS Online account to view the projects and plans that you create.
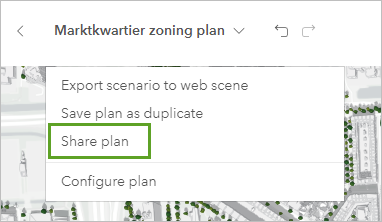
- On the ribbon, click Marktkwartier zoning plan and in the drop-down menu click Share plan.
- In the Sharing tab, set the following:
- For Collaboration, under Who can edit?, check Lock editing for non-owners.
- For Set sharing level, click Everyone (public).
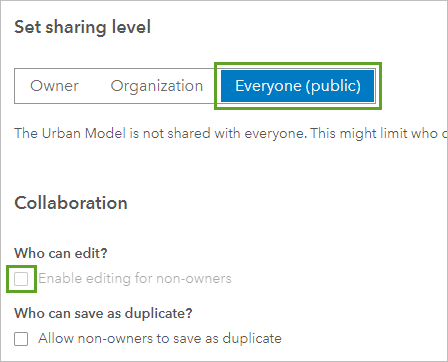
You can set the other options as per your choice
- On the ribbon, click the Return to plan icon and click the Return to overview icon.
Your zoning plan for the Marktkwartier area is now complete. First, you changed the zoning regulations, then developed new buildings, and finally analyzed the scenario. This last step is probably the most important one, as it means evaluating the extent to which the proposed development met the initial targets. All work would be irrelevant without an extensive analysis of your results and proposed solutions. Such analysis refers to the originally identified problems and targets, and it should answer these questions:
- What targets do my proposed solutions meet?
- What compromises do my proposed solutions imply?
- How do my proposed solutions address the identified environmental problems?
- How will my proposed solutions affect the environment in the future?
It is also important to understand and analyze the difference between plans and projects, and what role they play in climate-proof planning. Planning is not a simple straightforward process, but it happens throughout a long timeline. Including both projects and plans in an urban model helps to identify different moments in the workflow. Another difference is that projects are more concerned with individual buildings or parcels, while plans show the proposed replanning of the space in a whole neighborhood. When creating projects, you must insert the capacity indicators manually, while with plans, the capacity indicators are generated automatically.
Enable public engagement
An important part of planning is to engage with the different stakeholders, including the public. Urban is a web-based tool and allows users to share files, create groups, and adjust the sharing and editing of files. Planners can share an urban model with their planning team, and everyone can see and edit the content. Planners can also share the urban model with a client, while locking editing so that no new changes can be made by anyone but the owner. Urban also has a feedback feature through which the public, or anyone with a link to the project or an ArcGIS Online account, can post comments on plans and projects. It is vital for planners to take these comments into consideration, because climate-proof change requires full public support to be implemented efficiently.
Allow for feedback
The first step toward public engagement is to enable feedback in your model.
- On the ribbon, click Manage.

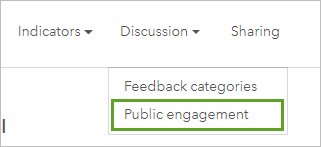
- Click on Discussion and in the drop-down menu select Public engagement.
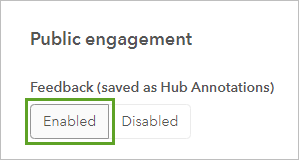
- For Public Engagement, click Enabled.
The public can only access the project and provide feedback if some elements are set to public. It is common to work on your urban model privately, and then share it to the public when you are finished. Next, you will change the sharing level for several of the items you have created to everyone, so the public can access your work.
- Go to your ArcGIS Online account page and click the Content tab.
- Click your Amsterdam Urban Model to view its overview page.
- Click Share, choose Everyone, and click Save.
- On the ribbon, click the Content tab.
- Click Amsterdam Urban Model Database View feature layer.
- On the Overview page, click Share, choose Everyone, and click Save.
Next, you will enable feedback for the Marktkwartier project and the Marktkwartier plan. The public can only comment on the plans or projects that have feedback enabled.
- Navigate to the browser that contains the urban model, click Return to overview and click Projects.

- Click Marktkwartier project to open it.
- On the ribbon, click the Discussion tab.

- In the Discussion pane, click Share project.
- In the Sharing tab, set the following:
- For Collaboration, under Who can edit?, check Lock editing for non-owners.
- For Set sharing level, click Everyone (public).

You can set the other options as per your choice
- On the ribbon, click on Discussion and in the drop-down menu choose Public engagement.
- For Public engagement, click Enabled.
Now all the settings are ready and you can test what the public view of your urban model looks like.
Test public feedback
Next, you will test the feedback capability of the urban model.
- In your urban model, click on Manage.
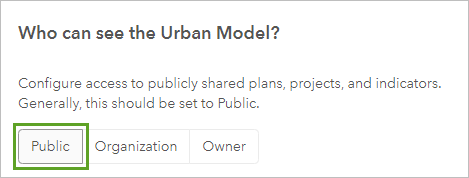
- On the ribbon, click on Sharing and for Who can see the Urban Model choose Public.
Next, you will test to see whether the link works for people without an ArcGIS Online account.
- In the Sharing tab scroll down and under the Embed Urban Model copy the URL from https to before the & symbol.
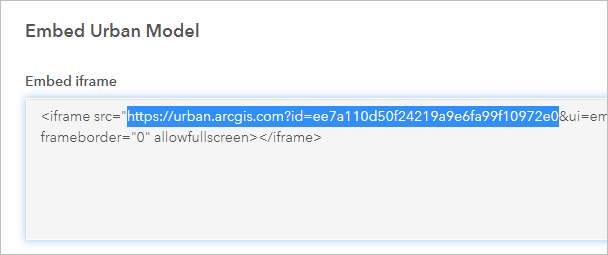
- Paste the link into the address bar to go to the public view of your model.
From there, you can see projects, plans, and indicators, but you cannot edit anything.
- On the other browser tab, sign out of your ArcGIS Online account.
- Below the ribbon, click Plans and open your Marktkwartier zoning plan.
Zoom in and explore the plan
- Return to the overview and click on Projects and open the Marktkwartier project. Explore the Marktkwartier project.
- Switch between scenarios 1 and 2 to see the differences between them.
- On the ribbon, click on Discussion and add a few comments of your choice.
Now if you go back to your urban model, you can see the feedback to each plan or project. You can see the feedback by clicking a plan or project and viewing the Discussion tab.
You have created an urban model for the city of Amsterdam. Then, you used this model to create a project and zoning plan geared toward creating more housing, while also making the Marktkwartier area more climate proof. You added green spaces to collect and store rainwater and to decrease the heat island effect. Finally, you learned the importance of analyzing your proposed scenarios, evaluating the pros and cons of each, and incorporating feedback from the public. These are all important steps in the planning process.


