Choose test markets for a start-up
Create a project
First, you'll create a project in ArcGIS Business Analyst Web App. Projects contain layers, reports, and other map items and help you manage and organize your data more efficiently. Projects also allow you to share your work.
Your project will map neighborhoods in Berlin, Germany. However, you can perform this workflow for any area in Germany or other countries.
- Go to Business Analyst Web App.
- If you are not already signed in, click Sign In. Sign in with your ArcGIS organizational account.
Note:
If you don't have an organizational account, see options for software access.
Your account must be licensed to use Business Analyst. If you are the administrator of your organization, you can assign yourself a license. Otherwise, you must contact your administrator for permission.
If this is your first time using Business Analyst, a Welcome window appears. If you've created a project in Business Analyst previously, you will not see the Welcome window, although you might see a What's new window.
- If necessary, close the Welcome or What's new window.
- If this is your first time using Business Analyst, click Create project. If you've used Business Analyst before, click Home and then, New project.
The Create project window appears.
- For Project name, type Berlin Bike-Friendly Neighborhoods and add your name or initials. Click Create.
A message explains that a project is being created. The process may take a few moments. When it finishes, a message confirms that the project has been created.
- Click OK.
- If necessary, in the list of the projects, point to your Berlin Bike-Friendly Neighborhoods project and click Open project.
The project appears.
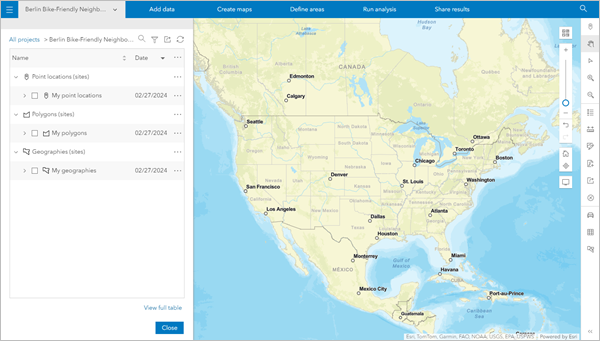
Note:
Depending on your organization's settings, the default extent and appearance of your project may differ from the example image.
You'll ensure the data you're using is for Germany.
- On the ribbon, click the menu showing the data source for your country or region.

- In the list of countries and regions, find Germany and click the Click for data source selections button.
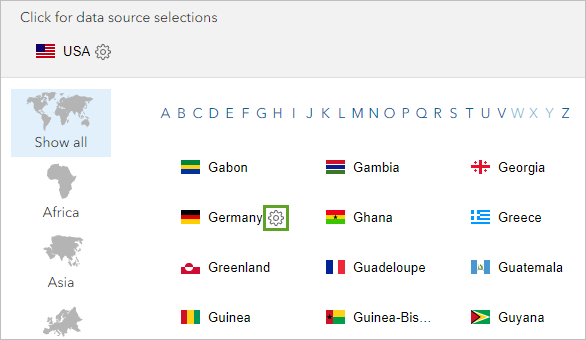
The two data sources available for Germany appear.
- Next to the Standard data source, click Apply.

The map navigates to Germany and the demographic data source is set to Germany (Standard).
Add demographic variables
Now that you've set your data source to Germany, you're ready to help Max and Renate find neighborhoods that meet the criteria for their bike kiosk start-up. Their target market has the following characteristics: a high percentage of households with children, low-middle income, and above-average levels of spending on recreational activities. You'll create a list of demographic data variables that represent these characteristics. Then, you'll narrow the analysis area to Berlin neighborhoods.
- On the ribbon, click Create maps and choose Smart map search.
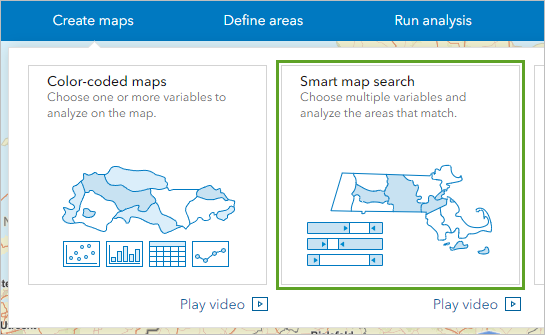
The Smart map search pane appears. It displays featured lists of preassembled variable sets that are popular with Business Analyst users. You'll create your own list of variables of particular interest to you.
- At the bottom of the workflow pane, click Browse all variables.
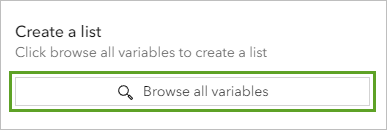
You'll use the Data browser window to select variables matching Max and Renate's criteria.
- Under Standard variables, click Households.
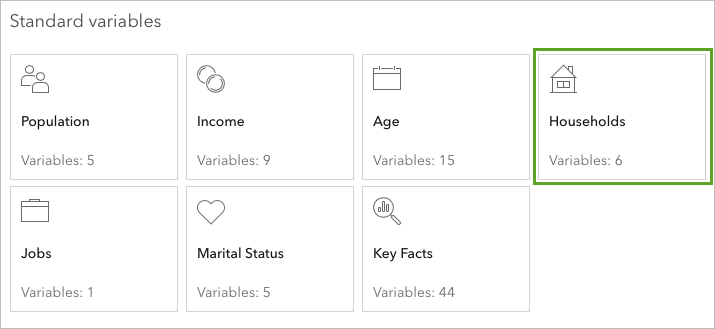
In the Households category, you'll find variables describing types of households in Germany, including the variable you're interested in: households with children.
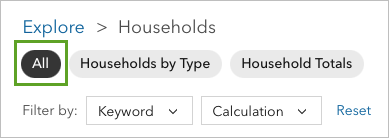
- Under Explore > Households confirm All is selected.
- Check the box for 2024 Households by Type: Multi-Person Households with Children.
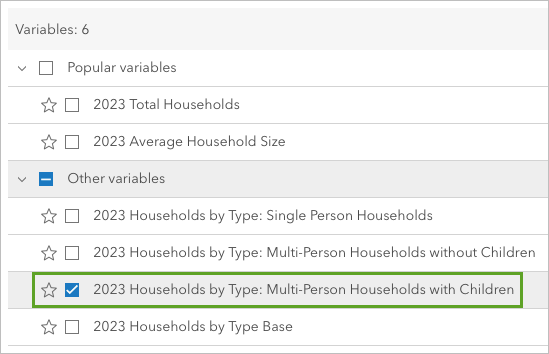
The variable is added to your Selected variables list at the top of the Data browser window. Next, you'll add variables that reflect low- and middle-income households.
- Under Categories, click Income.
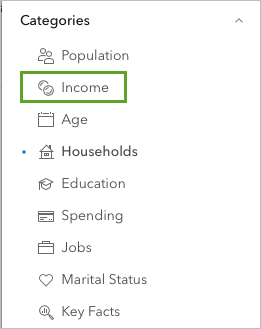
- Under Explore > Income, confirm All is selected. Check the boxes for 2024 Total Households in 2nd Income Quintile (€22,740 to €34,281 Euro) and 2024 Total Households in 3rd Income Quintile (€34,281 to €51,571 Euro).
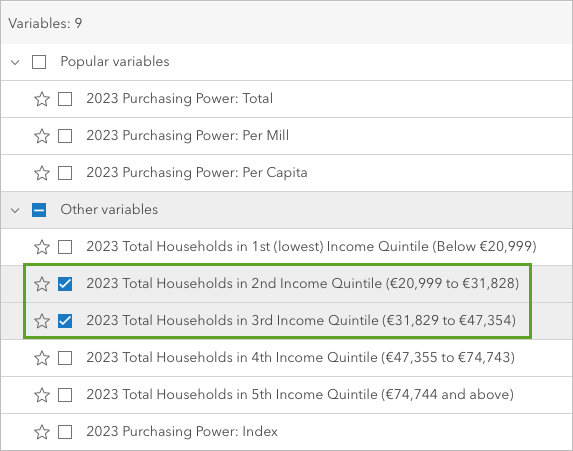
The two variables are added to the Selected variables list, making the count three. Next, you'll add a variable that reflects households with above-average levels of spending on recreational activities.
- Under Categories, click Spending.
- Scroll down and check the box for 2024 Recreational & Cultural Service Expenditures: Index.
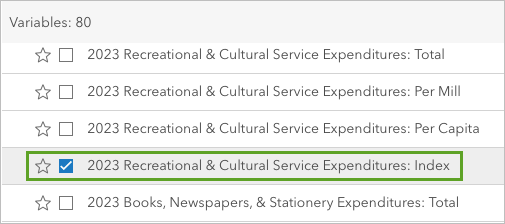
An index compares the value in the areas on the map to another value, such as the nationwide average. This index will indicate which areas have above-average spending on recreation compared to the German national average.
You've selected four variables in total. You'll save this list of variables and apply them to the map.
- At the bottom of the Data browser window, click Save list.

- For List name, type Bike-Friendly Indicators.
- For List icon, choose Shapes and icons. Under Transportation, click a bicycle icon.
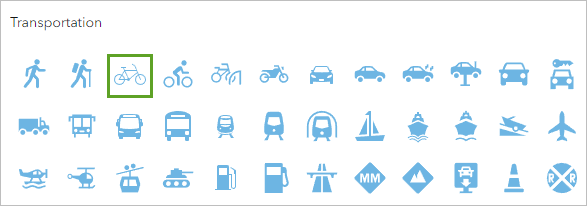
Tip:
You can use the search bar to find a bicycle icon more quickly.
- In the Save variable list window, click Save.
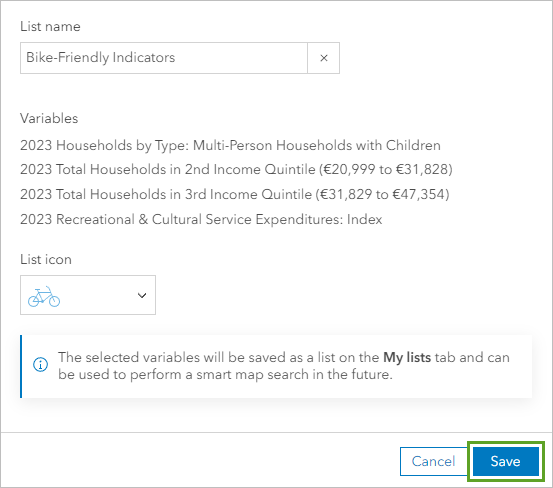
- At the bottom of the Data browser window, click Apply.
The smart map search workflow runs, applying the variables you selected to the entire map of Germany. Next, you'll refine your analysis extent to examine Berlin in particular.
- If a window appears informing you about using sliders to refine criteria, click OK.
- In the Smart map search pane, scroll down to the Geography section. Click the Analysis extent menu, search for Berlin, and choose the Municipality of Berlin.
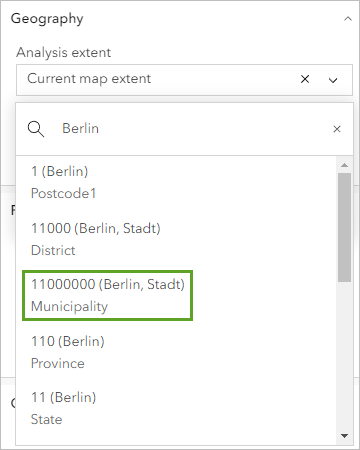
The map navigates to Berlin and limits the analysis extent. Next, you'll adjust the level of detail of the map so you can see individual neighborhoods.
- In the Geography section, for Level of detail, choose Postcodes5.
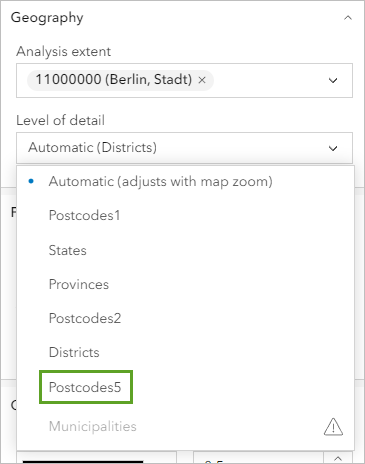
The map now shows the individual postcode boundaries within Berlin. These boundaries will enable you to examine your criteria at the neighborhood level.
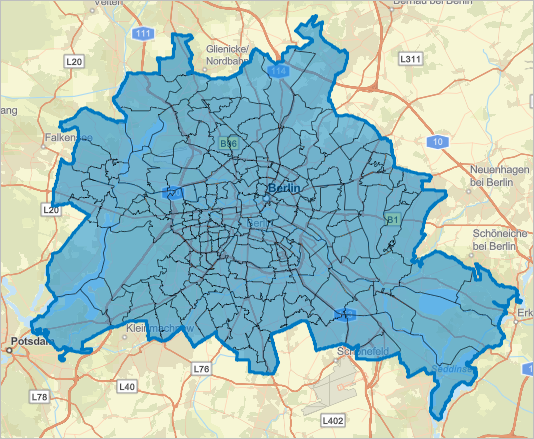
You've created a list of relevant demographic variables and narrowed the analysis area to Berlin neighborhoods. Next, you'll analyze and compare the neighborhoods based on the variables you chose.
Find bike-friendly neighborhoods
To help Max and Renate secure funding for their start-up, you need to identify 10 areas in Berlin that are highly likely to make use of bike kiosks. You've selected indicators that measure bike-friendly attitudes (children, income, and spending on recreation). Next, you'll set ranges for these variables to determine which neighborhoods are the most bike-friendly areas.
First, you'll change the Multi-Person with Children variable to use a percentage, instead of a raw count. Using a percentage allows you to compare the variable more easily across neighborhoods. The count of households does not consider how many people live in the neighborhood.
- In the Smart map search pane, scroll up to the Variable list section. For 2024 HHs: Multi-Person with Children, click Calculation: Count and choose Percentage.
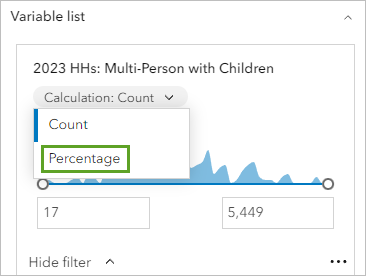
Next, you'll set a range threshold to the variable so only neighborhoods with a certain minimum value will appear on the map. This way, your map will only show neighborhoods with a suitable percentage of households with children.
- Adjust the range for the 2024 HHs: Multi-Person with Children variable so that the lower threshold is 20 percent. Press Enter.
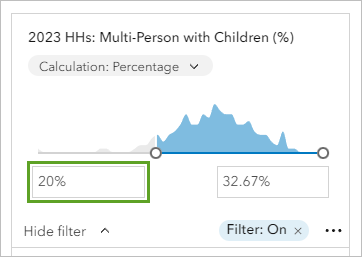
The map automatically filters out neighborhoods where fewer than 20 percent of households have children. You'll adjust the lower thresholds of the other variables to filter out neighborhoods that aren't demographically suitable for bike kiosks.
- Adjust the following variables:
- For 2024 HHs: 2nd Quintile (€22,740 to €34,281 Euro), change the lower threshold to 2,000 households.
- For 2024 HHs: 3rd Quintile (€34,281 to €51,571 Euro), change the lower threshold to 2,000 households.
- For 2024 Recreational Services: Index, change the lower threshold to 100.
The map updates to show all the areas that match your modified criteria.
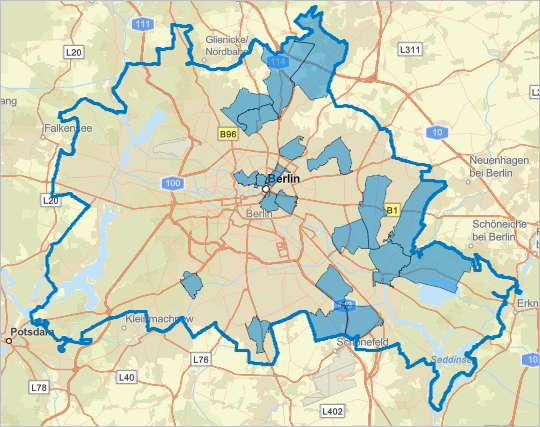
The Results pane shows that 16 postcodes match the criteria you entered.
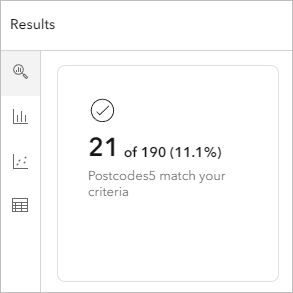
Now that you've set your basic criteria, you'll explore the data, refine the criteria, and narrow the results to the 10 most suitable neighborhoods.
- In the Results pane, click the Histogram button.

The histogram shows the distribution of data in a format similar to a bar chart.
- Under Chart settings, for Variable, ensure that 2024 HHs: Multi-Person with Children is selected.
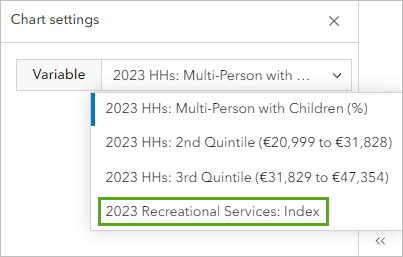
The histogram now shows the distribution of this variable across the postcodes.
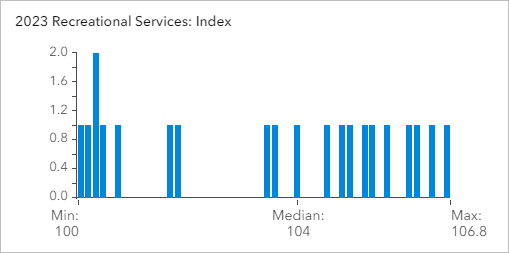
- Point to the bars to view the index value and how many areas have that value and how many do not.
There are 11 sites with a percent of households with children that have a value higher than the median of 23.66%. You'll adjust the households with children variable so that the lower threshold is 23.66%.
- In the Smart map search pane, for 2024 HHs: Multi-Person with Children, change the lower threshold to 23.66%.
- In the Results pane, click the Summary button.
The map now shows 10 postcodes meeting the bike-friendly criteria, with a particular focus on high spending on recreation.
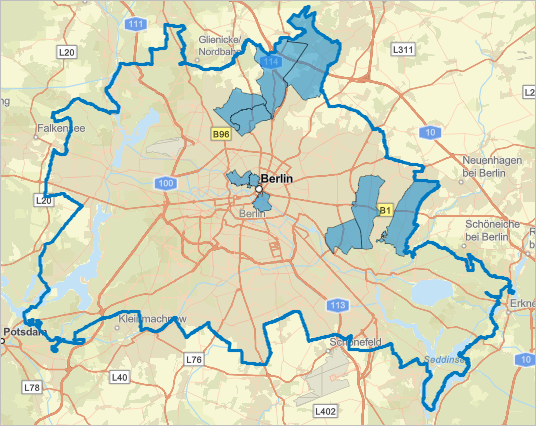
Next, you'll save your work.
- In the Smart map search pane, click Save layer.
- In the Save layer window, for Layer name, type Top 10 Bike-Friendly Berlin Neighborhoods and add your name or initials. Click OK.
After a few moments, your layer is saved.
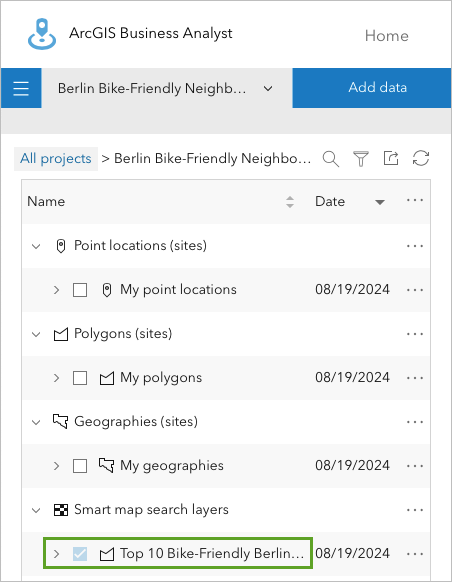
- On the ribbon, click Berlin Bike-Friendly Neighborhoods.

The layer is listed under Smart map search layers.
In this tutorial, you identified neighborhoods in Berlin suitable for Max and Renate's proposed bike kiosk start-up. You created a project in Business Analyst Web App, compiled a list of relevant demographic variables, and set thresholds to map neighborhoods meeting the desired criteria. Your result indicates the 10 neighborhoods most suitable for bike kiosks based on your criteria.
Though this workflow was focused on bike kiosks in Berlin, using the demographic data available in Business Analyst, you can replicate the workflow for almost any type of business throughout the world. All you need is to think of the demographic variables appropriate for your business and map them in your area of interest.
You can find more tutorials in the tutorial gallery.
