Explore the View Dome tool
The View Dome tool allows you to see the visibility from a given point in a 360 degree view. The View Dome tool colors the areas that are visible or not visible from the observer point in the center of the dome.
Open and explore the project package
First, you will download and open a project package containing the 3D scenes you will explore for this tutorial.
- Download the AssessVisibility project package.
- Locate the downloaded AssessVisibility.ppkx file on your computer. Double-click the file to open it in ArcGIS Pro. If prompted, sign in to your ArcGIS organizational account.
Note:
If you don't have access to ArcGIS Pro or an ArcGIS organizational account, see options for software access.
The project opens in ArcGIS Pro.
The project contains two global scenes, Exploratory Analysis SFC and Exploratory Analysis ESRI. Using each of the scenes, you will review and use Exploratory 3D Analysis tools with data for San Francisco and the Esri campus in Redlands, California.
- If necessary, click the Exploratory Analysis SFC scene tab to activate it.
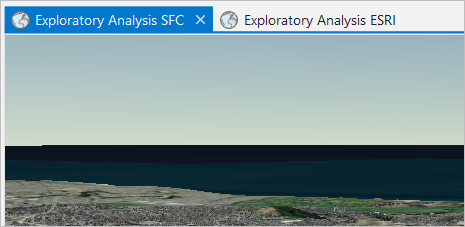
Next, you will review the Exploratory 3D Analysis tools you will use in this tutorial.
- On the ribbon, click the Analysis tab, and in the Workflows group, click the Exploratory 3D Analysis drop-down button.

- Review the available tools.
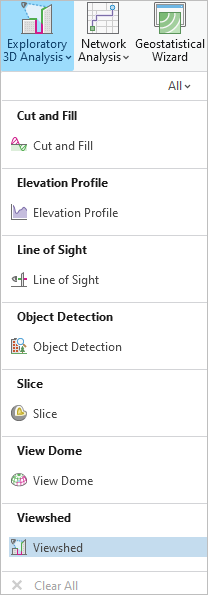
There are three exploratory tools you will use in this tutorial:
- View Dome—Determines the parts of a sphere that are visible from an observer located at the center
- Slice—Visually cuts through the view's display to reveal hidden content
- Viewshed—Determines the visible surface area from a given observer location through a defined viewing angle
Generate a view dome
View domes appear like spherical bubbles to indicate visibility that extends out from an observer location, showing what can and cannot be seen. In this step, you will use a view dome to better understand how urban canyons (areas where a street has tall buildings on both sides, creating a canyon-like environment) in downtown San Francisco can limit your ability to view the sky or other features.
- On the ribbon, click the Map tab. In the Navigate group, click Bookmarks, and choose SFC- FinancialDistrict.
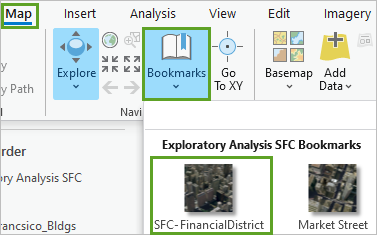
The scene updates to the extent of the San Francisco Financial District.
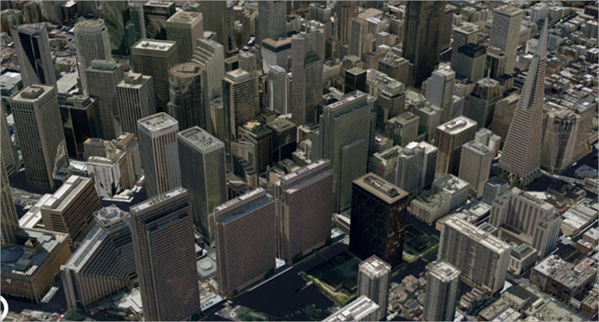
- In the scene, in the Navigator tool, click Show full control.
- Using the navigation tools, zoom in to and explore the Financial District in San Francisco to familiarize yourself with the area.
Tip:
To pan the map, press C and drag the scene. To tilt the scene, press V and tilt the scene. Alternatively, on the Map tab, in the Navigate group, point to the Explore tool to view a ToolTip with more information on navigating a scene with your mouse.
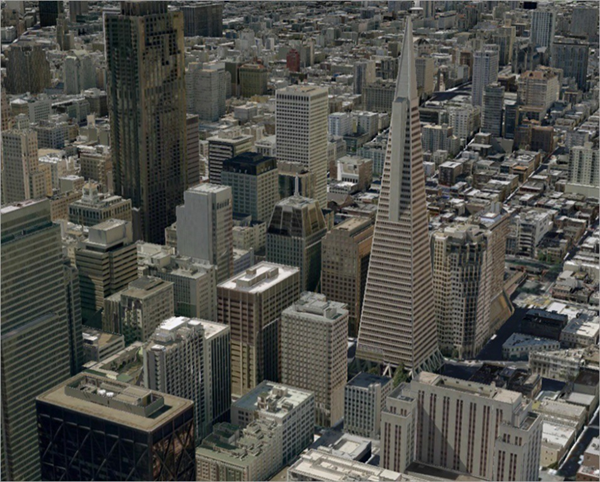
- On the ribbon, click Bookmarks and choose Market Street.
The scene centers on Market Street.
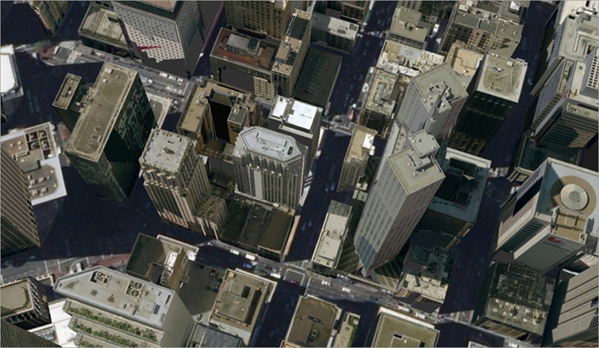
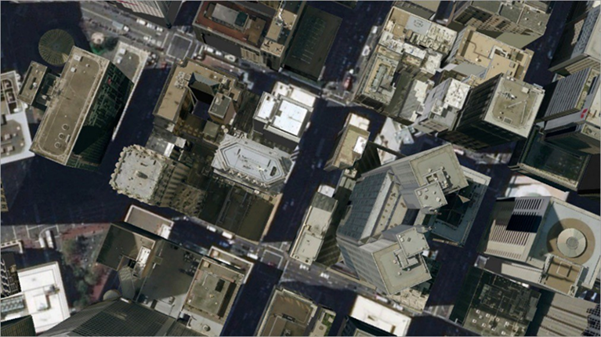
- Navigate the scene to position the view of the street looking straight down.
Tip:
Press P to view the scene perpendicularly downwards.
- On the ribbon, click the Analysis tab. In the Workflows group, click the drop-down menu for Exploratory 3D Analysis, and choose View Dome.
The Exploratory Analysis pane appears.
- Under Creation Method, choose Interactive Size.
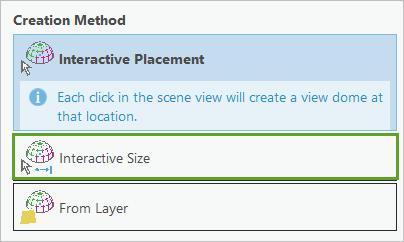
Next, to generate the view dome, you will click two locations on the scene. The first click will set the center location of the dome. The second click will set the radius of the dome.
- On the scene, click in the middle of an intersection surrounded by buildings.
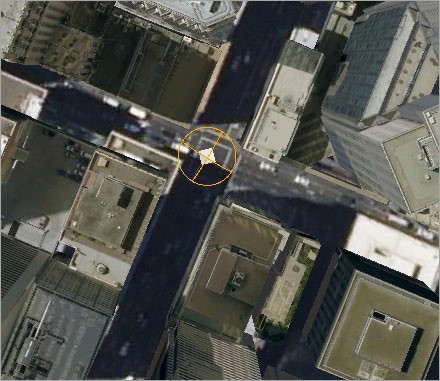
- Point and click a location about one city block away from the intersection.
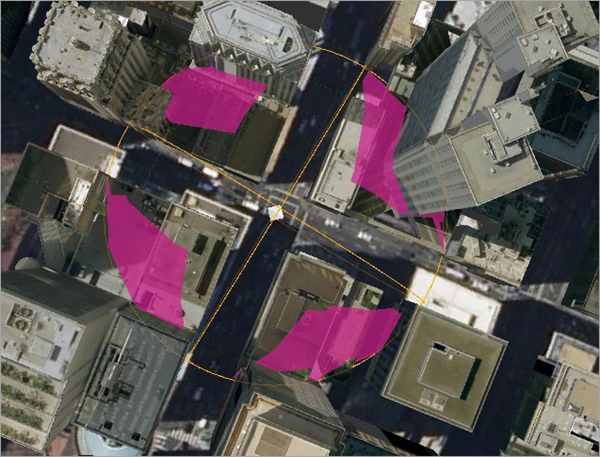
The view dome is generated.
Note:
If you want to re-create the view dome, you can right-click the center of your first click and click Delete. You can also use your Explore tool to pan your scene to the middle of your screen.
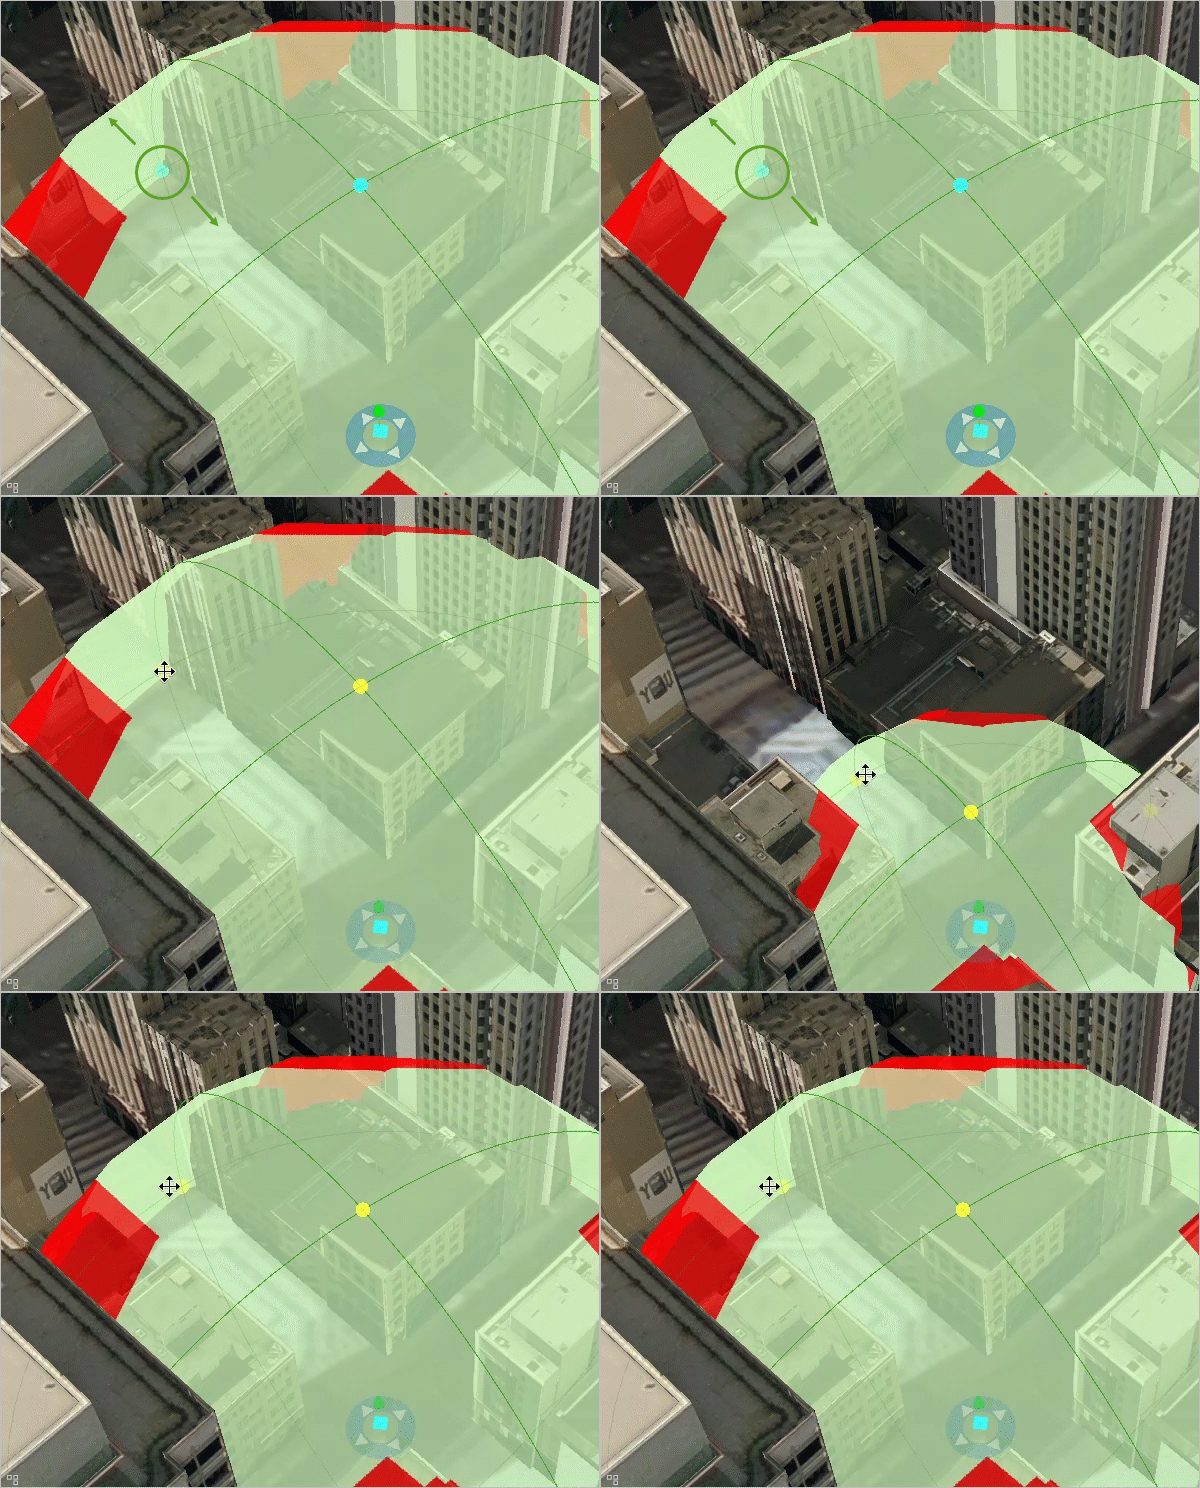
In the view dome, obstructed areas are shown in pink, while the uncolored area indicates a clear view of the sky. You can see how the visible areas of the view dome tend to be aligned with the street orientation.
Next, you’ll change the view dome symbology.
- In the Exploratory Analysis pane, click the Properties tab and expand the Global Properties group.
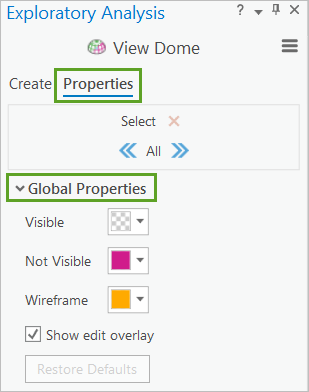
- Under Global Properties, update the settings as follows:
- For Visible, choose a light-green color.
- For Not Visible, choose red.
- For Wireframe, choose a dark-green color.
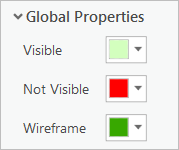
The scene updates and the view dome symbology is easier to interpret.
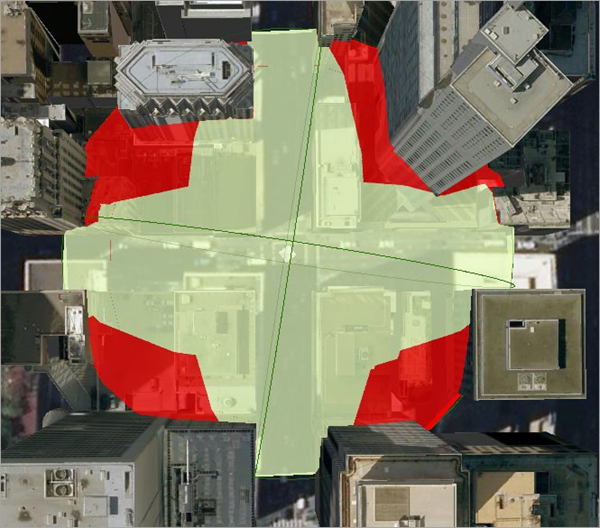
- Using the Navigator tools, explore the scene and observe which parts of the buildings may be obscured from the origin point of the dome.
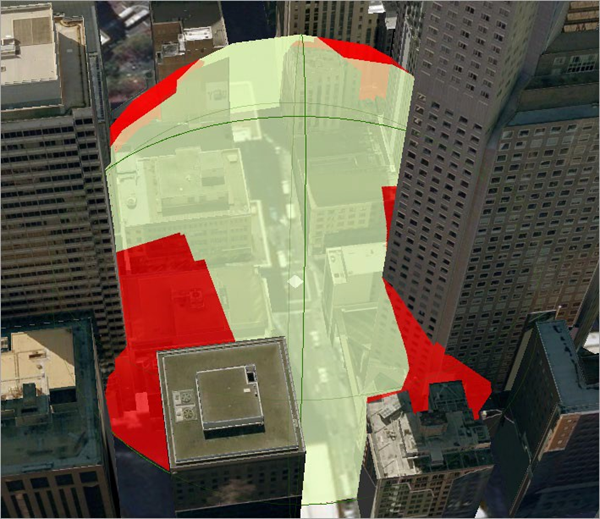
- Click the center of your view dome to activate its handles.
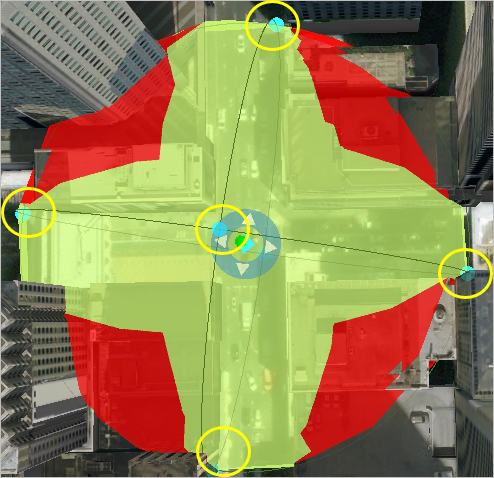
- Use the four handles around the edge of the dome to change its size and see how buildings intersect.
Note:
You can also move the dome around on the ground by grabbing the blue disc around the observer and dragging it to a new location.
The Exploratory 3D Analysis tools work not only with local multipatch and terrain data, but also with hosted scene layers, such as the textured San Francisco buildings, and with 3D symbols.
- On the Quick Access Toolbar, click the Save button.

- Click Yes when asked to save to a different version of ArcGIS Pro.
Explore the Slice tool
Use the Slice tool to clip into a building
The Slice tool allows you to interactively place a clipping surface in a scene that slices through one or more layers. It is useful for exploratory tasks in which you have nested layers that you want to investigate—like cutting into a 3D geologic model to understand how the different strata are organized or internally cut by faults.
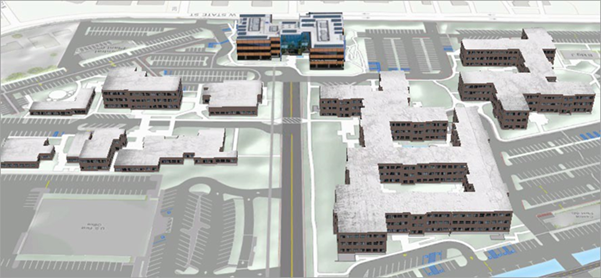
In this step, you will use a simple 3D map of the Esri headquarters in Redlands, California, to slice different layers and create ad hoc exploratory views of the campus and buildings.
- Click the Exploratory Analysis ESRI tab to activate that scene.
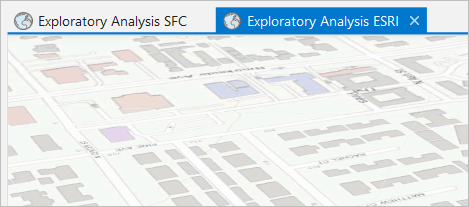
The scene opens to display the buildings and landscape of the Esri campus.
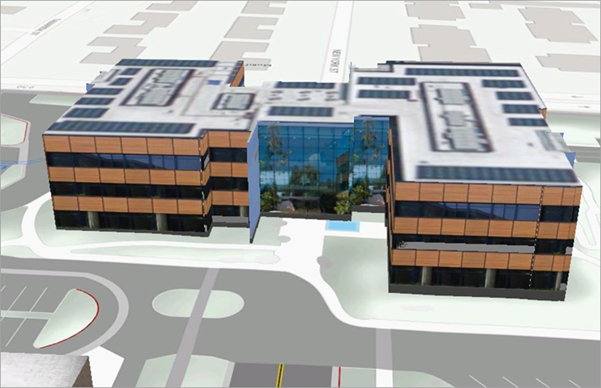
- Navigate to the front of Building Q, which has a distinctive wood and glass structure wall at the end of the center street.
- On the ribbon, click the Analysis tab. In the Workflows group, click theExploratory 3D Analysis drop-down menu and choose Slice.
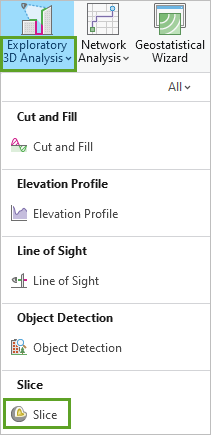
The Exploratory Analysis pane updates.
- In the Exploratory Analysis pane, for Creation Method, ensure Interactive Plane is selected and Plane Direction is set to Vertical.
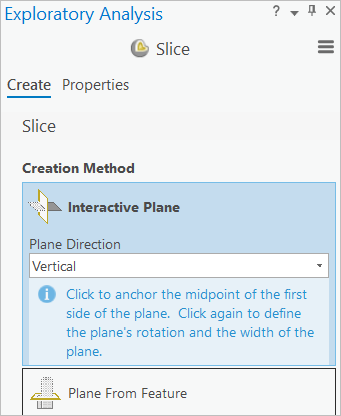
- In the Exploratory Analysis pane, click the Properties tab and expand Global Properties.
- Under Global Properties, for Wireframe, choose a green color, and for Cut Outline, choose a red color.

- In the Exploratory Analysis pane, click the Create tab and point to the scene.
Your pointer becomes crosshairs as you hover over the scene.
- Use the Navigator or navigation shortcuts to zoom in to the left front corner of the building.
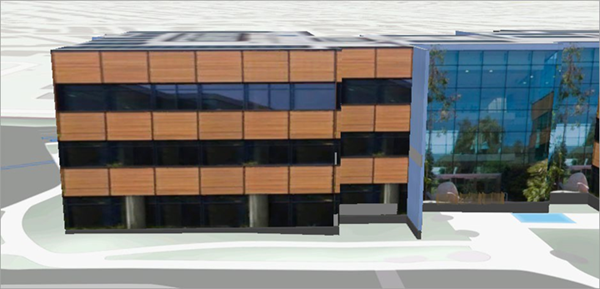
- Click the ground near the lower left corner of Building Q, and click a second point parallel to the front facade orientation to set the plane.
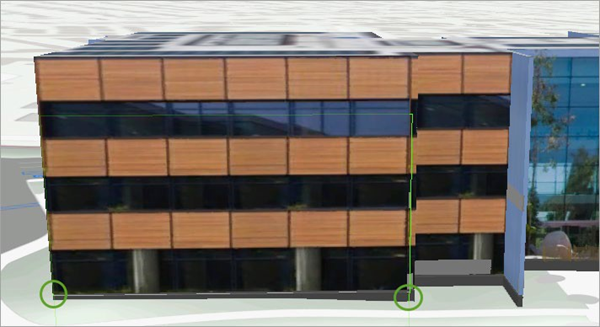
The front of the facade is removed, revealing the interior of the building.
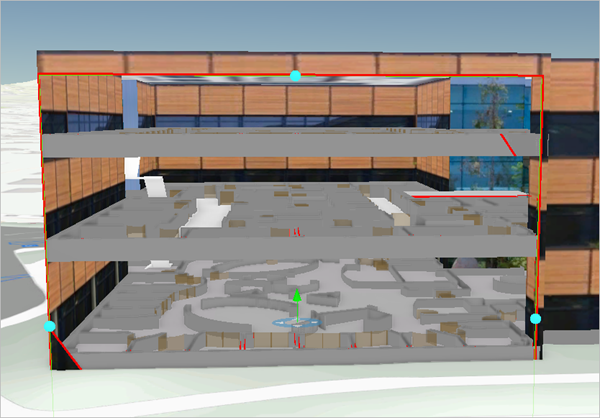
- Using the light-blue anchor points, extend the vertical slice plane to slice through the front of the building
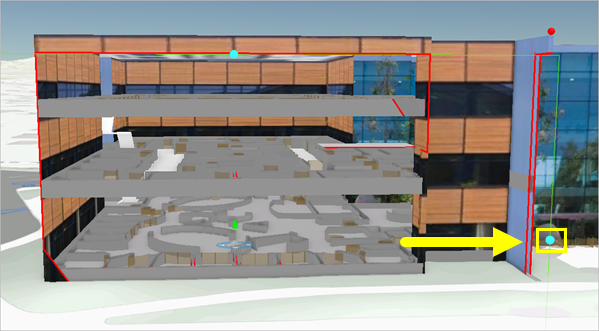
The slice navigator center point is a four-way arrow in the middle of your slice. Dragging the slice navigator in the direction of the arrows allows you to move the slice backward or forward.
- Drag the slice navigator toward the middle of the building.
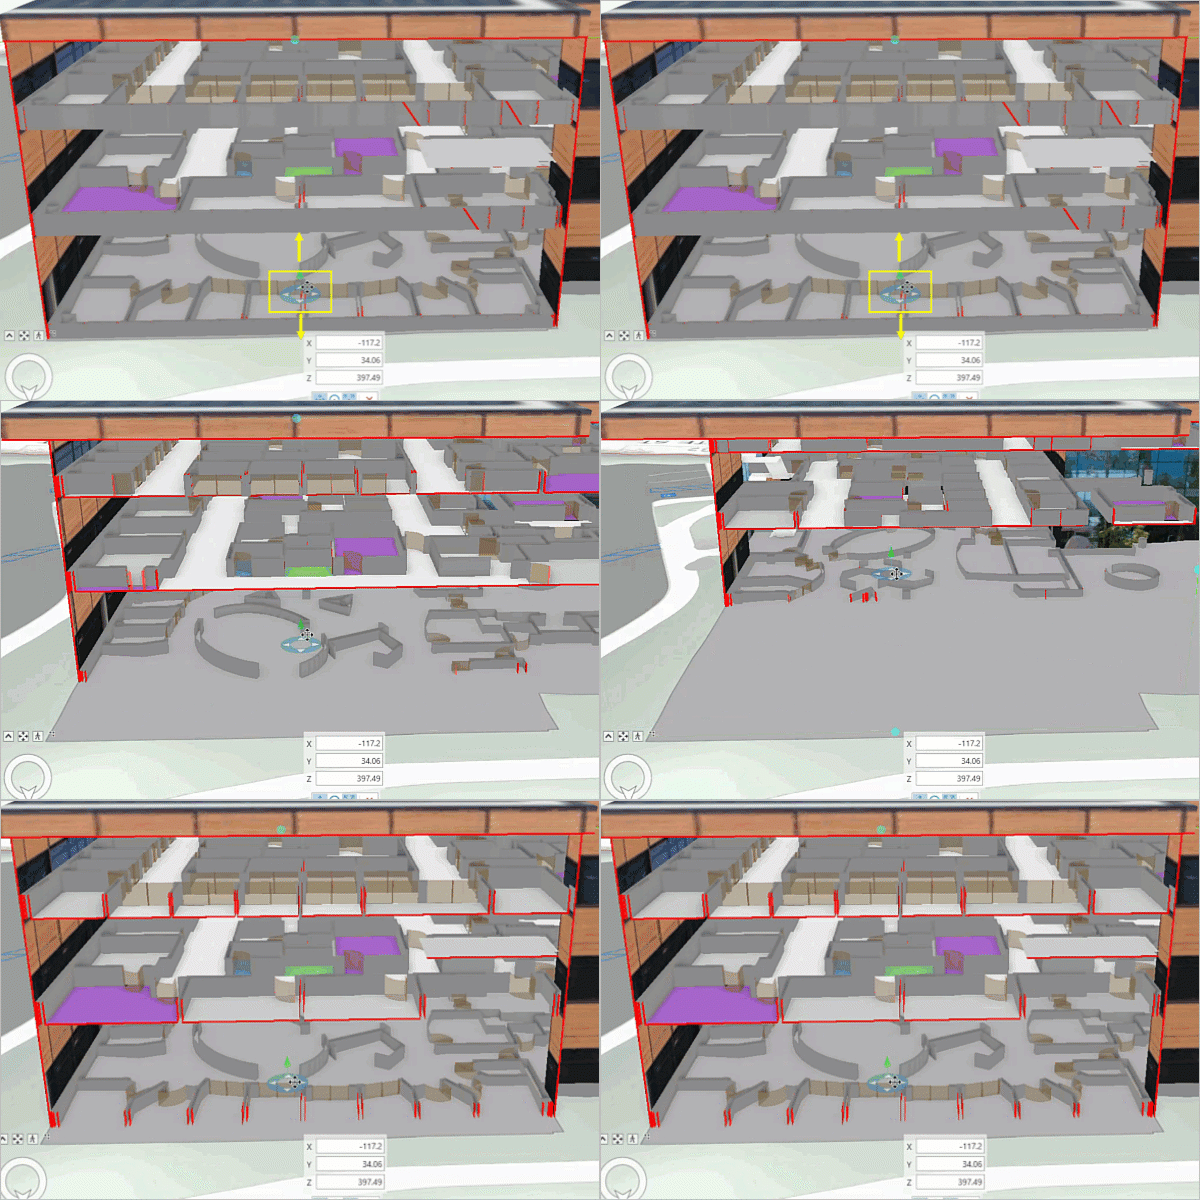
Note:
Optionally, use the slice navigator to change slice angle and direction. You can create some interesting interior views with the exterior walls peeled away—experiment with different plane orientations and angles.
Next, include the ground surface in the slice.
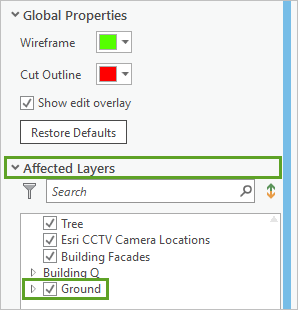
- If necessary, in the Exploratory Analysis pane, click Properties.
- Expand the Affected Layers group, and check Ground.
Now you can see underground, which is useful for subsurface data visualization.
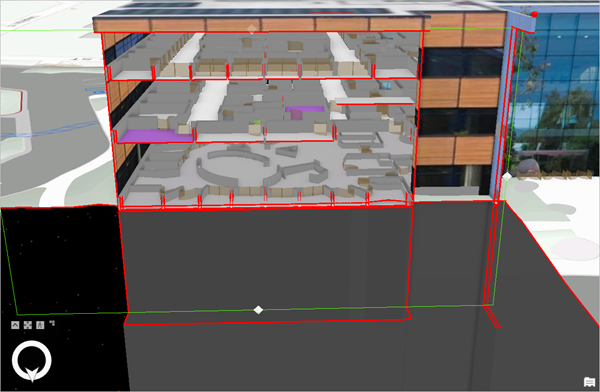
Isometric cutaways are a common method for viewing architectural models or drawings.
- On the ribbon, click the View tab. In the Scene group, click the Drawing Mode drop-down menu and choose Parallel Drawing Mode.
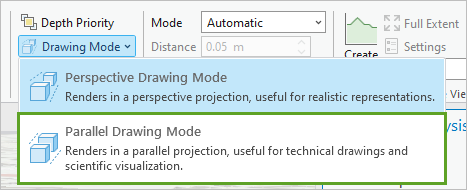
- Navigate the scene to see how the different drawing mode impacts the scene view.
- Click Drawing Mode again and change it back to Perspective Drawing Mode when you are ready to continue.
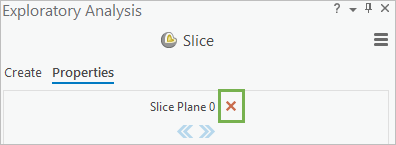
- In the Exploratory Analysis pane, click the Properties tab and click the red delete button to delete the exploratory objects.
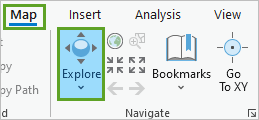
- On the ribbon, on the Map tab, in the Navigate group, click Explore to deactivate the Slice tool.
- Save the project.
Explore the Viewshed tool
Use the Viewshed tool to explore visibility from a CCTV camera location
Viewsheds are used to visualize which parts of the environment can be seen from a given observer location. Unlike a view dome, which is a spherical surface of a set size, a viewshed renders on the surface of the terrain and any 3D objects what is visible and what is not visible within a given distance.
In this step, you will again use the Exploratory Analysis ESRI scene.
- If necessary, use the Explore tool to navigate back to the area in front of Building Q.
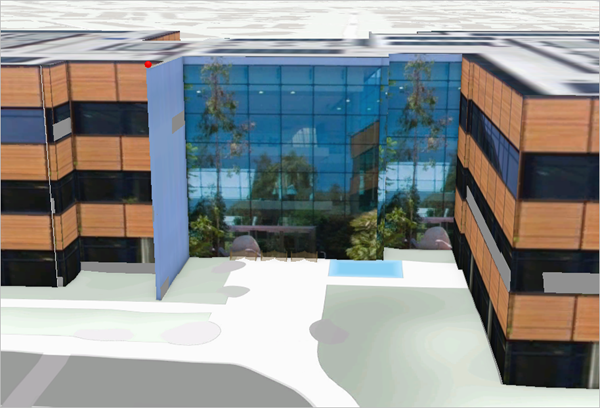
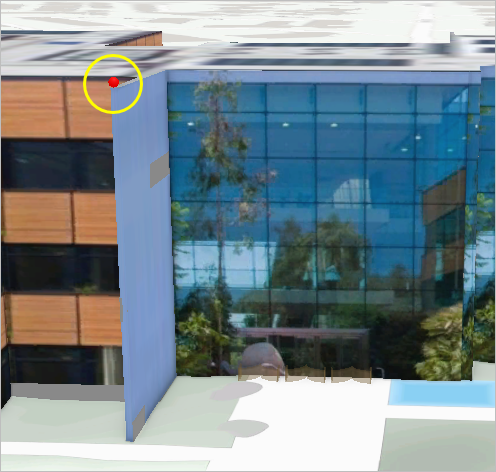
At the top of the third floor of the building is the location of the CCTV camera, to the left of the glass atrium. It is represented in the scene with a red dot.
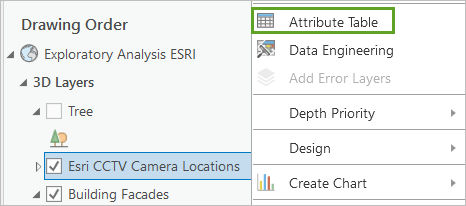
- In the Contents pane, right-click the Esri CCTV Camera Locations layer and choose Attribute Table.
- Review the Esri CCTV Camera Locations attribute table.
The attribute fields include camera properties such as camera rotation, height, and viewing distance.
The Viewshed tool can use these parameters to calculate what may or may not be visible based on the horizontal and vertical viewing angle and the minimum and maximum viewing distance of the camera.
- Close the attribute table.
- On the ribbon, click the Analysis tab, and in the Workflows group, click the 3D Exploratory Analysis drop-down menu and choose Viewshed.
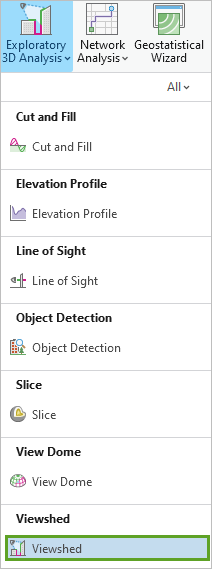
The Viewshed Exploratory Analysis pane appears.
- In the Exploratory Analysis pane, for Creation Method, choose the bottom From Layer option. Confirm Point Layer is set to Esri CCTV Camera Locations.
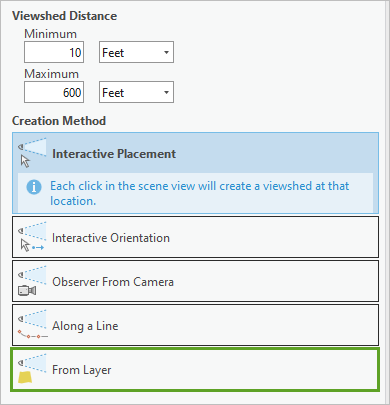
The Initial Viewpoint values for Heading and Tilt are automatically populated with fields from the Esri CCTV Camera Locations layer.
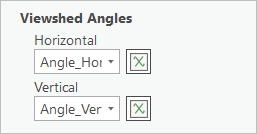
- Under Viewshed Angles, for Horizontal, choose Angle_Horizontal. For Vertical, choose Angle_Vertical.
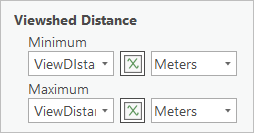
- Under Viewshed Distance, for Minimum, choose ViewDistance_Min. For Maximum, choose ViewDistance_Max.
- Click Apply.
- Zoom out to visualize what the camera can observe based on its current parameters.
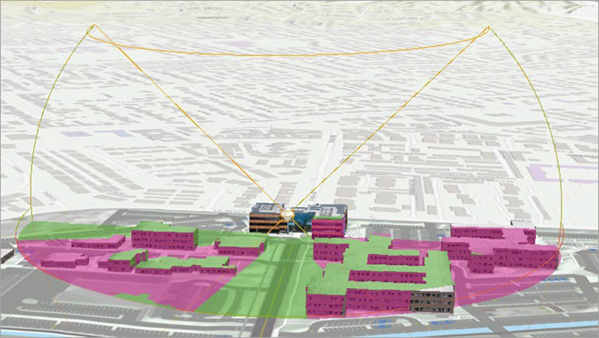
Facing north, all locations that are visible to the camera are rendered in green, while locations not visible to the camera are rendered in pink.
- Navigate the scene and observe how the 3D building objects and the placement of the camera impact the calculated viewshed.
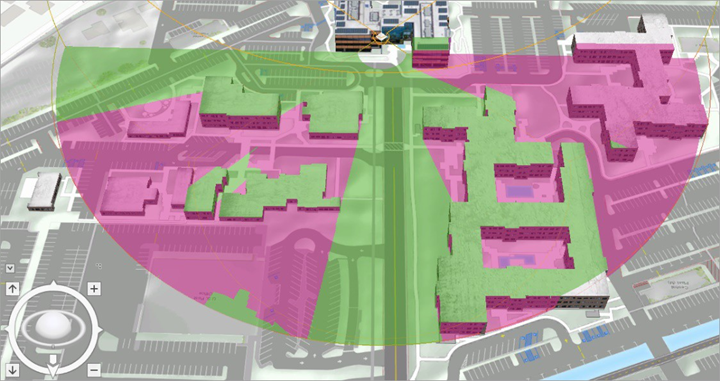
Many of the buildings obscure the visibility of the camera, and it appears to be most effective at observing the street and parking spaces in front of the camera. However, you have the trees layer turned off and the viewshed is currently not including trees in its computation of visibility.
- In the Contents pane, check the Tree layer.
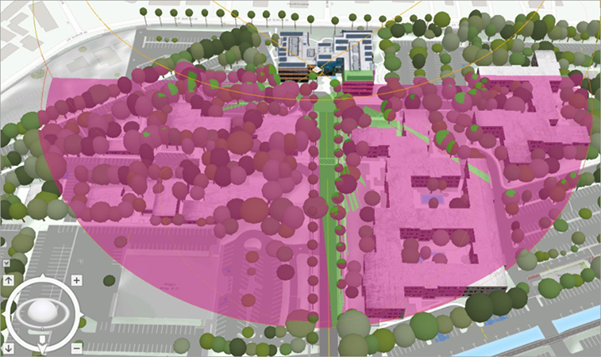
With the Tree layer turned on, the viewshed is recalculated and the impact of the trees is notable, as trees certainly impact visibility.
- Using the Navigator tool, adjust the scene to view the same direction that the camera is facing.
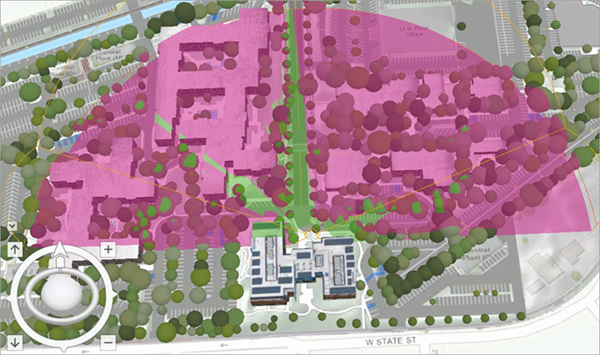
The camera's visibility is now largely confined to the street corridor and a few smaller paths between the tree canopy.
- Zoom in and observe how the south-facing parts of trees are also visible to the camera.
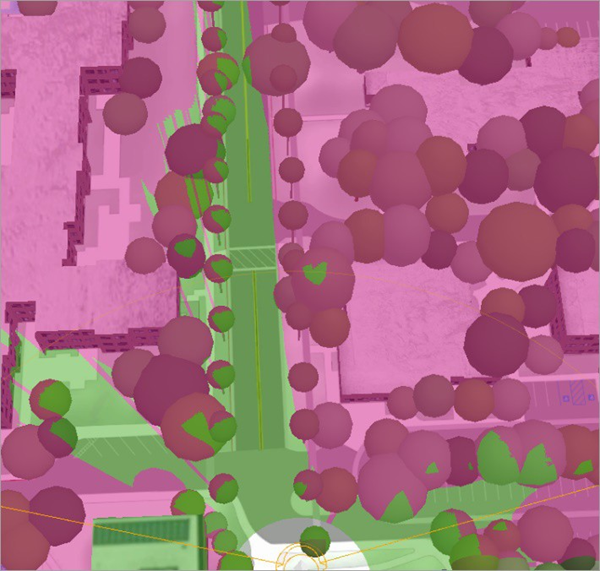
Trees have a big impact on viewsheds—without vegetation, about half of the campus was visible. With trees added, the viewshed was reduced to a narrow strip along New York Street. The Exploratory 3D Analysis tools in ArcGIS Pro allow you to quickly understand and test a variety of visibility scenarios.
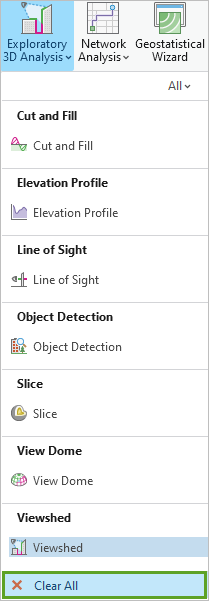
- On the ribbon, on the Analysis tab, click Exploratory 3D Analysis and choose Clear All.
- Save the project.
In this tutorial, you used the Exploratory 3D Analysis tools to conduct real-time visibility studies at the city and campus scale—employing the View Dome, Slice, and Viewshed tools. Using these tools, you learned how to conduct line-of-sight studies by placing observer locations interactively in the scene, and by loading observer locations from a predefined layer’s attributes.
You can find more tutorials in the tutorial gallery.

