Analyze midterm election results
Save a copy of the map
First, you'll sign in and save a copy of a map with election data so you can change it however you want.
- Open the Midterm Election 2018 USA map.
- Click Sign In.

- Sign in to your ArcGIS organizational account.
Note:
If you don't have an organizational account, you can sign up for an ArcGIS free trial.
- On the ribbon, click Save and choose Save As.

- In the Save Map window, fill in the following parameters:
- For Title, type 01 Election 2016 Swing States followed by your name or initials.
- For Summary, type Map of swing states in the 2012 USA Presidential Election.

- Click Save Map.
You've saved a copy of the map. Next, you'll look at the map's data.
Map swing states
Some of the map's data is for the 2012 and 2016 United States presidential elections. You'll look at this data, change its style, and examine differences between the outcomes of the two elections.
- Click the Show Contents of Map button.

The Contents pane appears. It lists all layers on the map.
This map includes six layers. Currently, none of these layers are turned on, which means they aren't displayed on the map. You'll turn on the States 2012 Election layer, which contains data for the 2012 United States presidential election between Barack Obama and Mitt Romney.
- Check the box for States 2012 Election.
The layer turns on. It shows the United States, with each state styled using an orange color.
The orange color isn't very meaningful, so you'll change the style based on the layer's attribute data. Attribute data is data that is associated with each feature in a layer. For example, in this layer, each state has attribute information about whether Obama or Romney won the state.
- Point to the States 2012 Election layer and click the Change Style button.

The Change Style pane appears. By default, this layer's style is Location (Single Symbol), which means every feature on the map has the same symbol.
- For Choose an attribute to show, choose F2012_elec.

The F2012_elec attribute tells whether a state was won by Obama or Romney. By changing the style to use this attribute, every state is styled either red or blue.
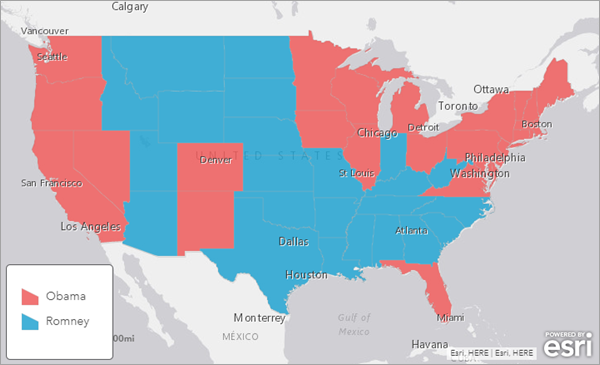
The legend explains what the two colors represent. States styled red were won by Democratic presidential candidate Obama, while states styled blue were won by Republican presidential candidate Romney.
The Democratic Party in the United States is usually associated with blue, while the Republican Party is usually associated with red. The default colors used by the map are backward, so you'll change the colors.
- In the Select a drawing style section, for Types (Unique symbols), click the Options button.
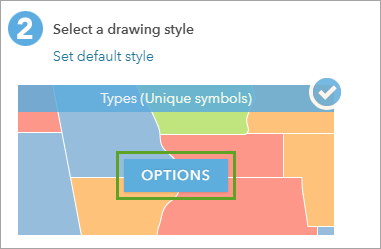
More options to change the style appear.
- Click the red symbol next to Obama.

A window appears. This window has options to change the color and transparency of the symbol.
- Click the blue color in the third row, third-to-last column.
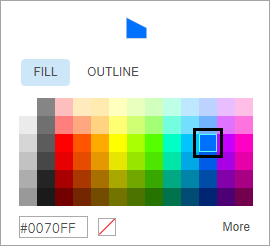
- Click OK. In the Change Style pane, click the blue symbol next to Romney.
- Click the red color in the third row, third column.

- Click OK.
- At the bottom of the Change Style pane, click OK. Click Done.
The colors on the map now match the colors of the political party of each candidate.
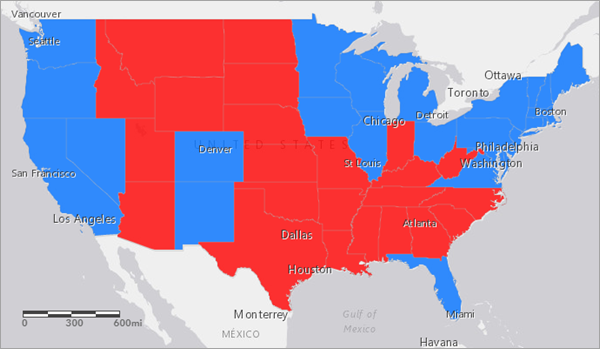
Next, you'll look at data for the next United States presidential election, which took place in 2016 between Democratic presidential nominee Hillary Clinton and Republican presidential nominee Donald Trump.
- In the Contents pane, check the box for States 2016 Election to turn it on. Uncheck the box for States 2012 Election to turn it off.
You'll also change the style for this layer.
- Point to the States 2016 Election layer and click the Change Style button.
- In the Change Style pane, for Choose an attribute to show, choose Win2016S.
This time, the Republican candidate is styled using red and the Democratic candidate is styled using blue, so you don't need to change the colors.
- Click Done.

Between 2012 and 2016, six states changed from blue to red. You'll create map notes for each of these states to emphasize them on the map.
- On the ribbon, in the search box, type Florida and press Enter.
The map navigates to the state of Florida.
- In the Search result pop-up, click Add to Map Notes.

A point feature is added to the map at the center of the state.
- Add map notes for the states of Iowa, Michigan, Ohio, Pennsylvania, and Wisconsin. When finished, zoom out to the full extent of the United States.
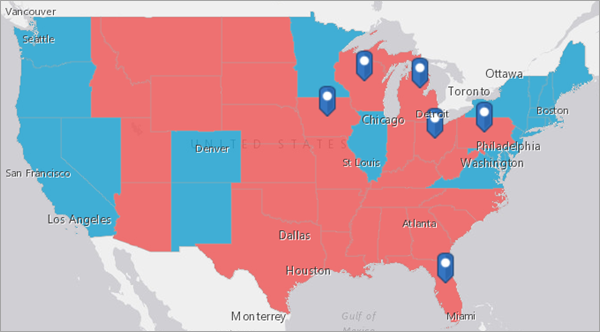
What does it mean for a state to be red or blue? In the United States, presidential elections are not decided by the total number of votes, also known as the popular vote. Instead, they're determined by the electoral vote. Each state has a specific number of electoral votes based on its number of senators and representatives. All states have two senators each, but the number of representatives depends on the state's population. For example, California (the state with the highest population) has 53 representatives, while Wyoming (the state with the lowest population) has only one representative. In the 2016 election, California had 55 electoral votes (53 representatives plus two senators), while Wyoming had three (one representative plus two senators).
By winning the popular vote in a state, a presidential candidate wins all of the state's electoral votes. The presidential candidate who wins a majority of the electoral votes wins the election and becomes president, regardless of the total number of votes they received across the country. For instance, in 2016, the candidate who won the popular vote lost the electoral vote and thus the election. That's why analyzing election results on a state-by-state basis is important for crafting future election strategies.
- On the ribbon, click Save and choose Save.
Compare voting percentages by party
Next, you'll compare voting percentages by party for counties in the United States.
- On the ribbon, click Save and choose Save As.
- In the Save Map window, for Title, type 02 USA Counties Election 2018 and add your name or initials. Click Save Map.
Another copy of the map is saved.
- In the Contents pane, uncheck States 2016 Election and Map Notes. Check Counties 2016 Election.
This layer contains attribute information about election results by county. In the United States, every state is made up of multiple counties. Like the layers you looked at previously, this layer's default style is not useful for understanding the election results, so you'll change it.
- Point to the Counties 2016 Election layer and click the Change Style button.
Previously, you styled layers by a single attribute that showed which candidate won each state. This style was useful for mapping states because it doesn't matter by how much a candidate wins a state. Even if a candidate wins a state by a single vote, they win all of the state's electoral votes. However, at the county level, it's more important to see the degree by which each candidate won.
To show this degree, you'll use predominance mapping, which compares attributes that share a common subject and unit of measurement to see which has the highest value. You'll compare attributes that show the percentage of votes for the Republican and Democratic candidate in each county.
- For Choose an attribute to show, choose %GOP.
Note:
In the United States, the Republican Party is sometimes called the GOP, which stands for Grand Old Party (the party's traditional nickname).
Predominance mapping requires multiple attributes.
- Click Add attribute.

The %DEM attribute is chosen as the second attribute by default. These are the attributes you'll compare.
- For Select a drawing style, for Predominant Category, click Select.
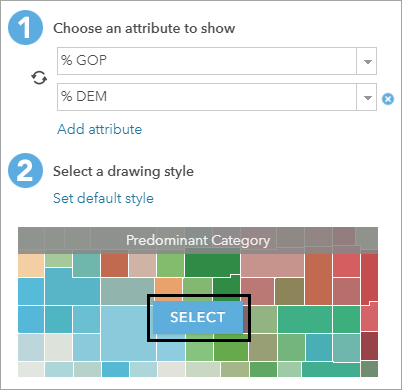
The style on the map is now based on predominance. Counties with a higher percentage of Republican votes are brown, while counties with a higher percentage of Democratic votes are yellow. You'll change the colors to red and blue.
- For Predominant Category, click Options.
- Click the brown symbol next to %GOP. Choose the red color in the third row, third column and click OK.
- Click the yellow symbol next to %DEM. Choose the blue color in the third row, third-to-last column and click OK.
The colors now match the party.
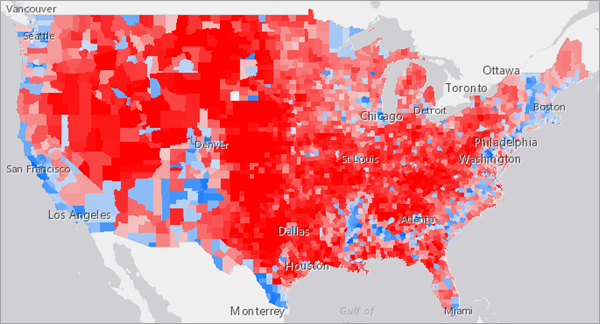
Not every county is the same red or blue color. Counties with lighter red and blue colors are counties where the percentage of Republican and Democratic voters was close, while counties with darker red and blue colors are counties where one party received a much higher percentage of the votes than the other.
- At the bottom of the Change Style pane, click OK. Click Done.
You'll turn on another layer to show the outlines of each state.
- In the Contents pane, turn on the USA States (Generalized) layer.
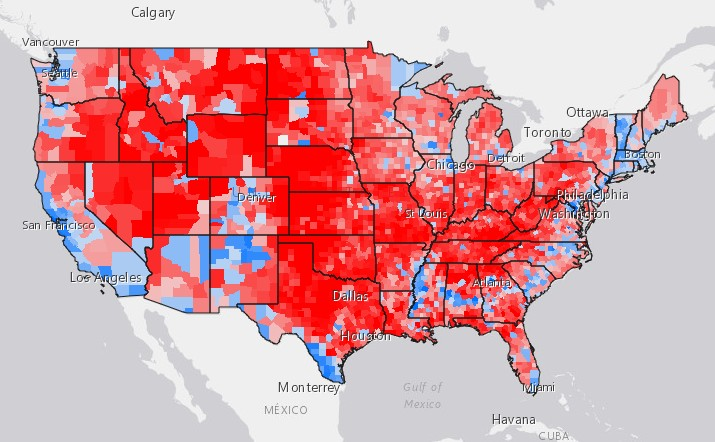
Presidential campaigns consume significant amounts of money, time, and people. These costs grow with each election cycle. Candidates cannot campaign everywhere. As a result, campaigns prioritize where to send resources in order to maximize the odds of winning the electoral vote. This map indicates regional voting trends and can help campaigns better understand which areas to target.
One shortcoming of this map is that it doesn't indicate the population of each county. Some counties in the United States have millions of people, while others have as few as 100. In several states, the Republican candidate received a majority of the vote in a majority of counties, but the Democratic candidate won the state by winning a small number of counties that have significantly more people. It's important for campaigns to consider the population of each county and state before deciding to commit resources to it.
Tip:
If you want to see the total number of votes in each county, click the county on the map. A pop-up appears with all of the attribute information associated with the county. The Total_Votes attribute shows the total number of votes. Try clicking several counties in a single state to see how much the number of votes can vary from county to county.
- Save the map.
Examine voting percentages in a single state
Next, you'll look at a single state (Virginia) in more detail.
- On the ribbon, click Save and choose Save As.
- In the Save Map window, for Title, type 03 Virginia followed by your name or initials. Click Save Map.
You'll filter the counties layer to only show counties in Virginia.
- In the Contents pane, point to the Counties 2016 Election layer and click the Filter button.

- In the Filter window, build the expression state is Virginia.

- Click Apply Filter and Zoom to.
The map centers on the state of Virginia and only shows Virginia counties.

The counties with a lighter shade of blue or red indicate a narrower difference in voting percentages between both political parties.
- Save the map.
Identify redrawn congressional districts
A congressional district is a geographic designation that elects a single representative to the United States House of Representatives. (As mentioned previously, the number of these representatives helps determine how many electoral votes a state receives.) State governments usually redraw the nation's 435 congressional districts every decade.
The United States Constitution mandates reapportionment, which is the equal division of congressional seats based on population. Gerrymandering occurs when a party redraws political boundaries to maximize the number of districts favorable to them.
Note:
See American redistricting history for more information about the history of reapportionment and gerrymandering in the United States.
Normally, reapportionment is based on the decennial United States Census count; however, judges can order, and legislatures can redraw, new lines during the intervening years. In 2016, a federal judge ordered new congressional lines that ultimately impacted five of Virginia's districts. The new maps took effect between the 114th United States Congress in 2016 and the 115th U.S. Congress in 2018.
You'll examine the differences between the congressional districts of the 114th and 115th Congress.
- On the ribbon, click Save and choose Save As.
- In the Save Map window, for Title, type 03 Virigina Districts followed by your name or initials. For Summary, type Map exploring differences between the 114th and 115th congressional districts in Virginia.
- Click Save Map.
- In the Contents pane, turn off the Counties 2016 Election layer and turn on the USA 114th Congressional Districts layer.
The layer contains congressional districts across the county. You'll filter the layer to only show districts in Virginia, where they were redrawn in 2016.
- Point to the USA 114th Congressional Districts layer and click the Filter button. In the Filter window, create the expression STATE is VA.
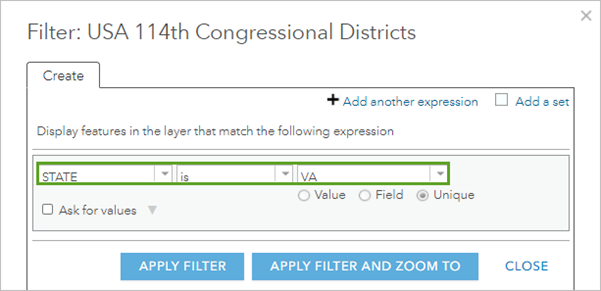
- Click Apply Filter.
- Turn on the USA 115th Congressional Districts layer.
You'll filter this layer the same way.
- For the USA 115th Congressional Districts layer, click the Filter button. Create the expression STATEEFP is 51 and click Apply Filter.
Next, you'll identify the five congressional districts in Virginia that had their boundaries redrawn. You'll label each district so its name appears on the map.
- For the USA 114th Congressional Districts layer, click the More Options button and choose Manage Labels.

- In the Label Features pane, change the following parameters:
- For Text, choose DISTRICT FIPS.
- Check the box for Halo.
- Adjust the Visible Range slider until the labels appear on the map.

- Click OK.
- For USA 115th Congressional Districts, click the More Options button and choose Create Labels.
- In the Label Features pane, change the following parameters:
- For Text, choose CD115FP.
- Check the box for Halo.
Both layers have labels.
- Click OK.
- Uncheck and check the USA 115th Congressional Districts layer.
By comparing the two layers, you can see differences between the congressional districts. Which congressional districts in Virginia changed between the 114th and 115th Congress?
Based on the map, the congressional districts on the eastern side of the state were redrawn, while those to the north and west remained the same. In particular, the districts labelled 01, 02, 03, 04, and 07 were redrawn.
- Save the map.
Style congressional districts
Next, you'll use predominant mapping to show how congressional districts voted in 2016.
- Click Save and choose Save As.
- In the Save Map window, for Name, type 05 VA Districts Voting followed by your name or initials. For Summary, type Map using predominant mapping to show how congressional districts in Virginia voted in 2012 and 2008.
- Click Save Map.
- Turn off the USA 114th Congressional Districts layer.
Now, only the USA 115th Congressional Districts layer and the USA States (Generalized) layer are turned on. You'll style the congressional districts layer the same way you styled counties, comparing votes for each candidate.
- For the USA 115th Congressional Districts layer, click the Change Style button. For Choose an attribute to show, choose Clinton 2016.
- Click Add attribute and choose Trump 2016.
- For Select a drawing style, for Predominant Category, click Select.

- Click Options.
- Click the symbol next to Trump 2016. Choose the red color in the third row, third column and click OK.
- Click the symbol next to Clinton 2016. Choose the blue color in the third row, third-to-last column and click OK.
- At the bottom of the Change Style pane, click OK. Click Done.
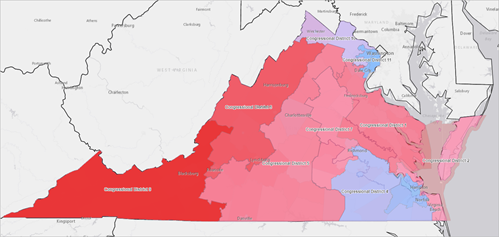
- Save the map.
Identify polling station gaps
A precinct is among the smallest voting districts recognized by the United States Census Bureau. It's roughly the size of a neighborhood. A polling place is where ballots are cast. The location, proximity, and structure of a polling station can influence how people vote. For example, voting at a school could prompt people to support an education tax increase. Also, more precincts in an area may shorten lines and increase voter turnout.
Next, you'll identify gaps in voting locations in Fairfax County, Virginia. To do so, you'll determine how much of the county is within a three-minute drive of a voting location.
- Open the Midterm Election 2018 Fairfax map. Click Sign In and sign in to your ArcGIS organization.
- Click Save and choose Save As. In the Save Map window, for Title, type 06 Fairfax Precincts and Polling Places followed by your name or initials.
- Click Save Map.
- Click the Show Contents of Map button and turn on the Polling Places layer.
- Point to the Polling Places layer and click the Perform Analysis button.

- Click Use Proximity and choose Create Drive-Time Areas.

The Polling Places layer is already chosen as the default point layer.
- Under Measure, for Driving Time, type 3.
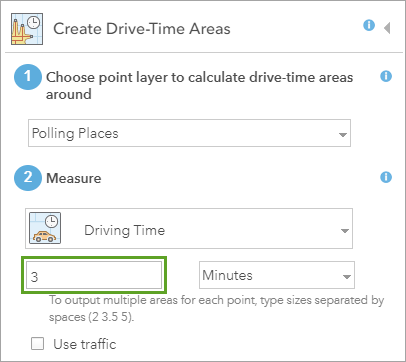
- For Result layer name, add your name or initials.
- Uncheck Use current map extent and click Run Analysis.
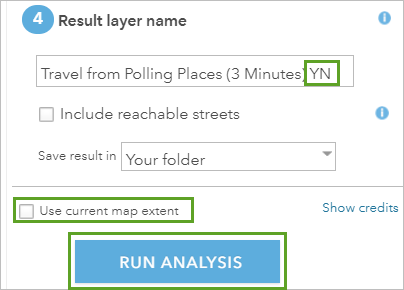
- Click Run Analysis.
The tool takes a few moments to run. When it completes, it adds a layer to the Contents pane and to the map.
Next, you'll change the style of one of the map layers to better see the drive-time areas.
- In the Contents pane, for Voting Precincts, click the Change Style button.
- Click Options and click Symbols.
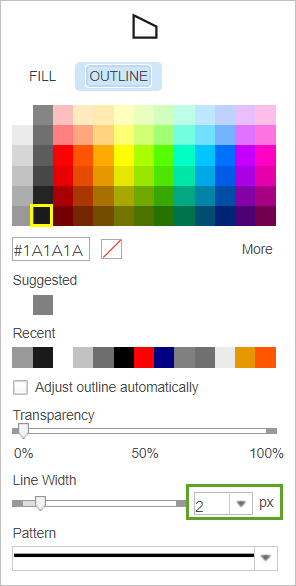
- On the Fill tab, click No Color.

- Click the Outline tab. Change the color to black (sixth row, second column) and increase the Line Width to 2 px.
- Click OK. At the bottom of the Change Style pane, click OK and click Done.
- Save the map.
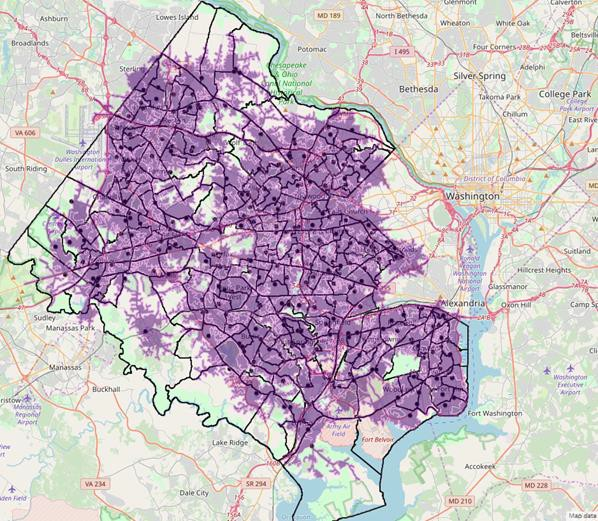
Purple areas are those within 3 minutes of a polling location. Most of the county is covered by these areas, but some places are not. A few of the areas that are far away from polling places are military bases or parks, so polling places aren't needed. But there are some residential areas in the center and western edges of Fairfax County that could use a polling location.
Share your results with a story
ArcGIS StoryMaps allows users to combine maps with text, images, and multimedia content to present data through a narrative. Next, you'll create a story from your six local, state, and national political maps.
- At the top of the page, click Home and choose Content.
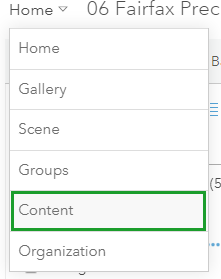
- In the list of your content, locate and click the 01 Election 2016 Swing States web map.
The web map's details page opens.
- Click Create Web App and choose StoryMaps.

Your map loads into the ArcGIS StoryMaps builder with placeholder text.
- For Title your story, type 2018 Midterm Election Analysis.

- On the ribbon, click Design.

The Design pane appears.
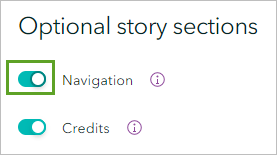
- For Optional story sections, turn on Navigation.
- For Theme, choose Slate. Close the Design pane.
- Scroll down and point under the map.
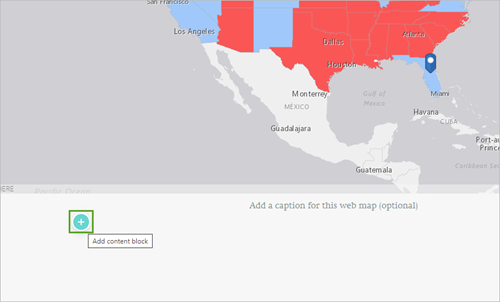
The Add content block button appears.
- Click the Add content block button and choose Text.

- In the Text Edit Bar, click Paragraph and choose Heading. Type 2016 Swing States.
- Scroll up and point to the upper left of the map until the Move Content button becomes visible.

- Drag the Move Content button and drop the map under the heading.
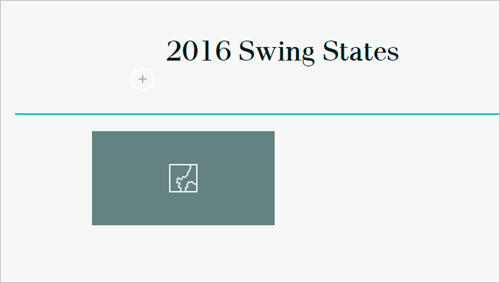
- Under the map, click the placeholder caption text and type Republican (red), Democratic (blue), and swing states from the 2016 presidential election.
- Point under the map, click the Add content block button, and choose Text.
- For Paragraph, choose Heading and type 2018 County Election Results.
- Point under the heading, click the Add content block button, and choose Map.
- Choose 02 USA Counties Election 2018 (your initials) and click Place Map.
- Update the caption accordingly.
- Add maps and captions for the other four maps you created in this lesson.
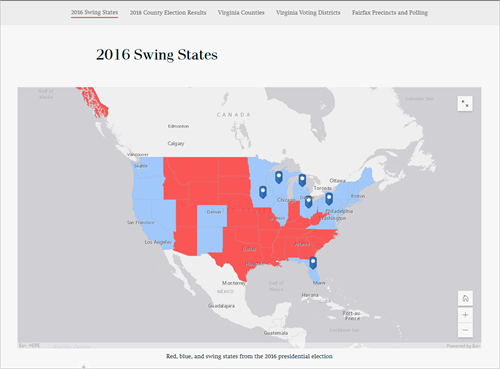
Your story is designed with navigation links so viewers can quickly see each of your maps. You're ready to share your story.
- On the ribbon, click Publish. Set the sharing level to Everyone (Public) and click Publish story.
Note:
You may be prompted to share web maps that do not have permissions set to the same level. If prompted, click Yes, share these items.
On the ribbon, you can click any of the social share buttons to share your story.

In this lesson, you created, analyzed, and interpreted political maps featuring the United States presidential election results and congressional districts in Virginia. You also created a story with ArcGIS StoryMaps for sharing. The maps you created could help inform the next election campaign.
You can find more lessons in the Learn ArcGIS Lesson Gallery.

