Symbolize 3D layers
Your 3D animation needs to show a social media audience how the expansion of San Francisco's rail network will help connect predicted housing growth with downtown. The video needs to communicate key information about the project in a compelling way, so as a first step, you'll need to symbolize the data.
Open the map package
Your colleague on the planning commission shared the transit data as a map package, so you can quickly add it to your ArcGIS Pro project and start working.
- Sign in to your ArcGIS organizational account.
Note:
If you don't have an organizational account, see options for software access.
- Under New Project, click Start without a template.
- On the Quick Access Toolbar, click the New button.
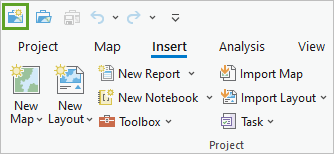
- In the Create a New Project window, for Name, type SF Transit Extension.
- Make sure Create a new folder for this project is checked and click OK.
- Download the TransitLineExtension map package and extract it to a location you can easily find, such as your Documents folder..
- On the Insert tab and click Import Map.

- Browse to where you saved the TransitLineExtension.mpkx file and double-click it to add it to the project.
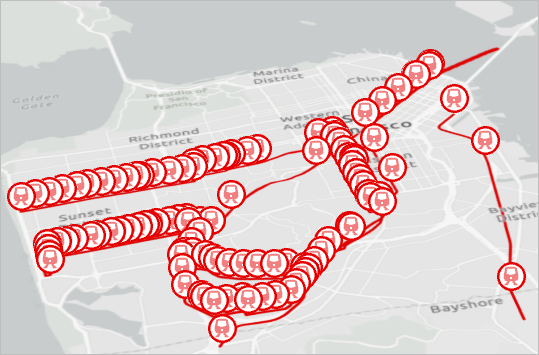
Note:
If you receive a warning related to data changes, click OK to ignore and continue.
The scene contains several layers already, including housing data, transit data, and walksheds. Most layers have a current and future version that you'll use to determine the most needed transportation line.
- Save the project.
Clip data for visualization
First, you'll clip the data to limit the visual extent of the scene. Because you only need to show San Francisco, clipping the view to that area of interest will help keep people focused when they watch the video. Removing extra data will also help your map draw faster and export more quickly.
- On the ribbon, on the Map tab, click Bookmarks and choose CLIP.
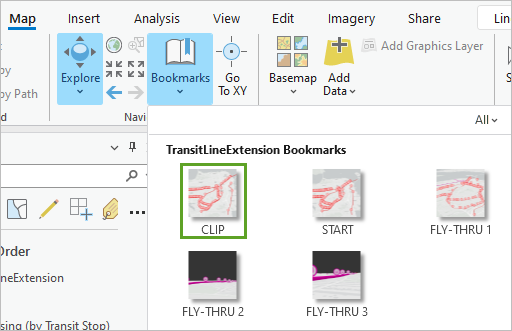
Note:
In 3D, the best way to preview how you will clip the view is to navigate the camera to a perpendicular and north-facing viewpoint. You could also navigate to this view by pressing the P and N keys on your keyboard.
Next, you'll clip the view and layers to the view extent.
- In the Contents pane, double-click TransitLineExtension.
The Map Properties window appears.
- In the Map Properties window, click the Clip Layers tab.
- Click No clipping and choose Clip to a custom extent. For Get extent from, choose Current visible extent.
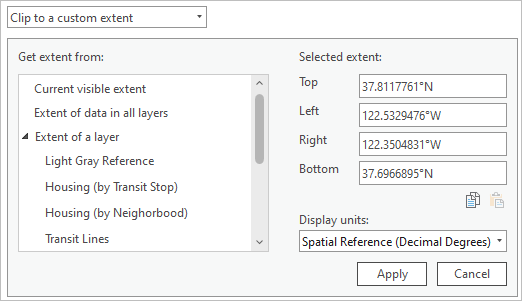
- Click Apply.
The layers are clipped to the current map extent. This clip also applies to the basemap, so you'll set a dark theme for the background behind the basemap.
- In the Map Properties window, click the General tab. For Background Color, choose Gray 80%.
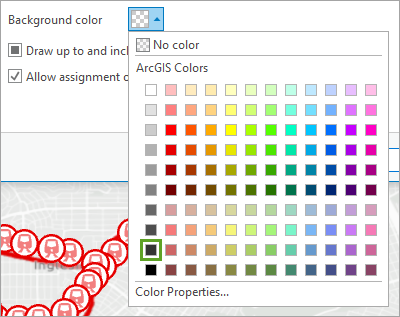
- Click OK.
The clip and background color are applied.
- Press V and drag the scene to tilt it.
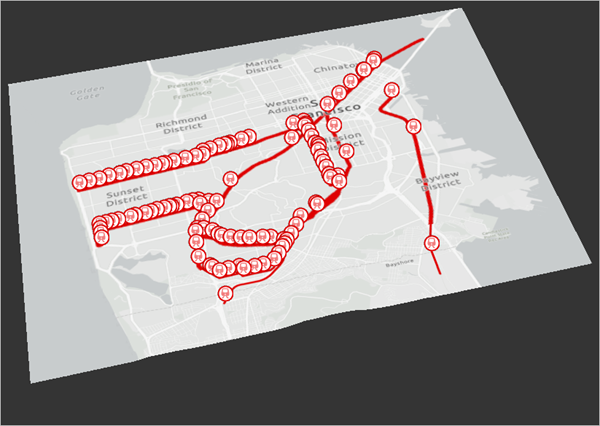
Now you have a smaller area to work with and a background that won't be distracting if the camera pans over it.
Symbolize transit lines
Next, you'll update the symbology for the transit lines. Currently they are draped on the ground as a flat 2D layer. For a more interesting visual effect, you'll display them as half-buried tubes. To give the layer 3D vector symbology, you'll move it into the 3D Layers category.
- In the Contents pane, drag the Transit Lines layer into the 3D Layers group.
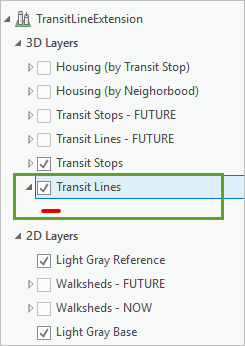
The lines disappear. They are now being shown at a zero elevation, or sea level, so they're underground beneath San Francisco's hilly terrain. When you finish symbolizing the layer, you'll want the tubes to be on the ground and to be shown in a real-world size. Both properties can be defined for the entire layer.
- In the Contents pane, double-click the Transit Lines layer. In the Layer Properties window, click the Elevation tab.
- For Features are, choose On the ground.
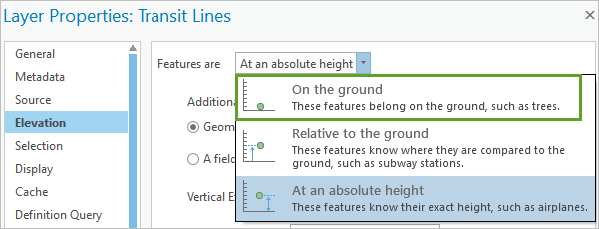
When you apply the changes, the Transit Lines layer will be drawn on the ground, which is defined by the current elevation surface, WorldElevation3D/Terrain3D. Before you close the Layer Properties window, you'll set the units you want the layer to display in.
- In the Layer Properties window, click the Display tab and check the Display 3D symbols in real-world units box.

- Click OK to apply the changes and close the window.
Tip:
When line features are drawn on the ground, their vertices are used as the connection points to the surface. If you have a long line that only has a few points, you might need to densify it, or add more intermediate vertices, to have it more closely match the surface.
You might see more of the red lines now, but the symbol is still using default calculated settings, including a flat line profile. To make sure lines can be seen from larger distances and all viewing angles, you want to use a large tube symbol.
- In the Contents pane, click the Transit Lines symbol.
Clicking the symbol for a layer opens the Symbology pane to that layer's properties.
- In the Symbology pane, click the Properties tab. Click the Layers tab.
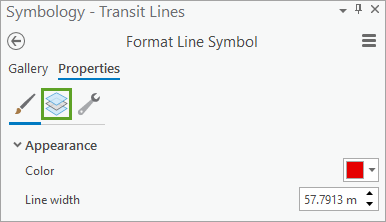
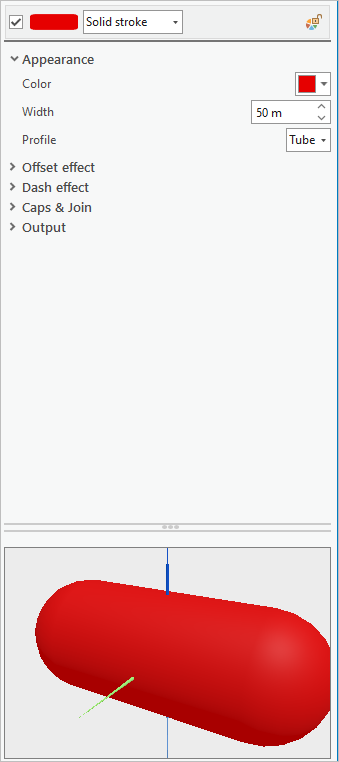
- If necessary, expand Appearance and set the width to 50 m.
- For Profile, choose Tube. Click Apply and close the Symbology pane.
The red tubes are now visible throughout the scene. If you zoom in and out, the tubes maintain a fixed physical size and the transit stop points seem to grow and shrink.
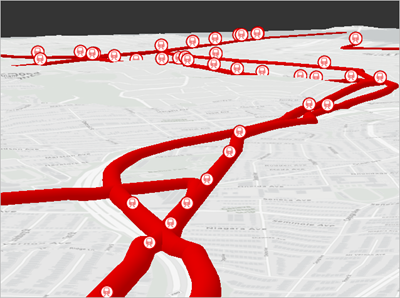
This effect occurs because the point features are still using screen-space size, drawing in the same number of pixels rather than with a measurable 3D distance. While screen-space size is often useful for point markers because you can see them from any viewing distance, for this scene you want them to be visually tied to the rail lines.
Symbolize transit stops
As you did with the transit lines, you'll also show the stops in real-world units.
- In the Contents pane, double-click the Transit Stops layer.
- In the Layer Properties window, click the Display tab and check the Display 3D symbols in real-world units box. Click OK.
- If necessary, in the Contents pane, expand the Transit Stops layer. Click the symbol to open the Symbology pane.
- If necessary, in the Symbology pane, click the Properties tab and click the Symbol button.
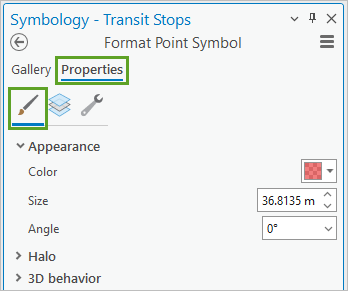
The symbol is now much smaller than the outline, so you will adjust the outline size.
- For Size type 80 m and press Enter
- Click the Layers tab and click the circle outline symbol. For Size, type 80m and press Enter. .
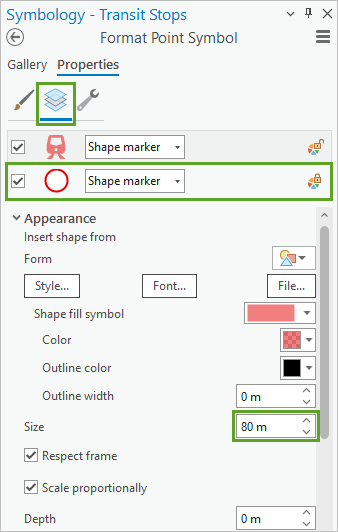
Now when you zoom, the transit stops are a fixed physical size, but they're half-covered by the tube symbol. This is because the points are also drawn on the ground. You can lift them using a cartographic vertical offset.
- Click Apply.

- In the Contents pane, double-click the Transit Stops layer and click the Elevation tab. For Cartographic Offset, type 25 meters.

- Click OK.

Note:
The tube is 50 meters wide, so you only need to lift the point symbol half that distance.
The Transit Stop layer's symbols are always pointed toward the camera, even when you tilt the scene. This effect is known as billboarding, and the default option is full rotation. As with the screen-space size, this is a good default for point markers because it guarantees the symbol can be seen properly from anywhere in the view.
For this scene, however, it's preferable to give them a tighter binding to their physical location, and you can do that by using signpost rotation instead. The way the symbol moves with the camera is worth authoring because it will be captured in the video you'll create later.
- If necessary, in the Contents pane, click the Transit Stops symbol to open the Symbology pane.
- In the Symbology pane, on the Layers tab, expand the Rotation group. For Billboard, choose With signpost rotation.
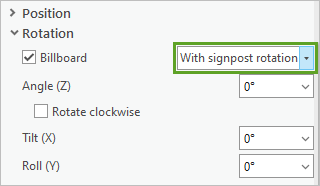
- Repeat this step for the outline symbol. For Billboard, choose With signpost rotation and click Apply.
- Rotate around the view and note how the billboarded symbols are displayed.
- Save the project.
Symbolize future transit data
the Transit Stops - FUTURE and Transit Lines - FUTURE layers have already been authored for you using the same symbology properties. The future transit lines are shown in a different color, but to make them more visually different, you'll change the tube symbol to a dash.
- In the Contents pane, check the Transit Stops - FUTURE and Transit Lines - FUTURE layers to turn them on.
- On the ribbon on the Map tab, click Bookmarks and choose FLY-THRU 3.
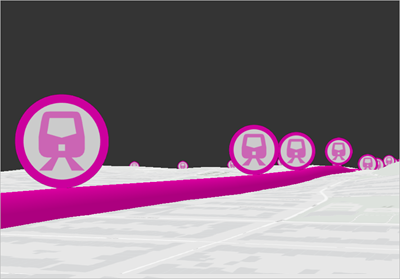
The color for the proposed rail line is already symbolized in a different color, but it doesn't really communicate that the line does not exist yet. You'll add a dashed effect to help provide that information in the video.
- In the Contents pane, expand the Transit Lines - FUTURE layer and click the symbol.
- On the Properties tab, click the Layers tab and expand the Dash effect group.
- For Dash type, choose the first dash option (the more spaced-out equidistant lines).
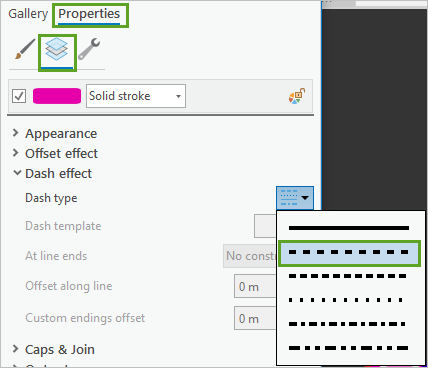
This option sets a 5-meter-by-5-meter dash for the layer. You'll make more changes before you apply them.
- For Dash template, type 100 25.
The dashes will now be 100 meters long with a gap of 25 meters between them.
- Expand Caps & Join, set Cap type to Butt, and click Apply.
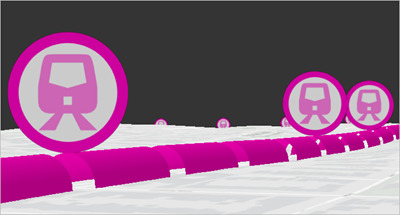
The proposed rail line is now visually different from the existing lines. Now that you're done symbolizing the transit data, you'll focus on authoring other aspects of the scene.
Add building data
The scene is looking more visually interesting, but it's hard to get an idea of scale. While distance between transit stops looks very small on the map, from a practical on-the-ground viewpoint they're well-spaced. To better show scale, you'll add buildings to the scene as a reference feature to help the viewer imagine how many people would be serviced by this railway.
- On the ribbon, on the Map tab, in the Layer group, click Add Data.

- In the Add Data window, on the left pane, under Portal, click ArcGIS Online.
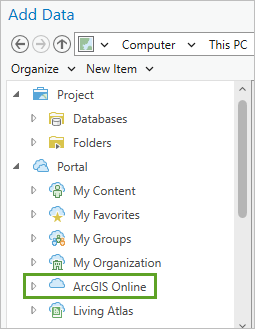
The Portal options allow you to search for data hosted on ArcGIS Online or in your ArcGIS Enterprise portal. The ArcGIS Online option allows you to search for content hosted anywhere on the site, including in the ArcGIS Living Atlas, your own content, and other users' public content.
- In the search bar, type San Francisco 3D buildings and press Enter.
- Choose the San Francisco 3D buildings scene layer and click OK.
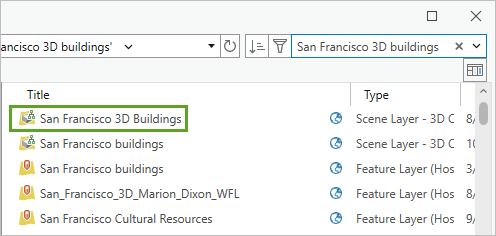
This data was created by PLW Modelworks, LLC, using 3D Model by PLW Modelworks, and is hosted on ArcGIS Online.
Note:
Not all cities will have building content available from an online service, so other techniques—such as extruding building footprints—may be needed for your area of interest.
The buildings help provide a better understanding of the visual scale, but the buildings are textured (that is, they have imagery on their exterior). This doesn't fit the clean, thematic look of the rest of the scene. To better match the plain grays of the supporting data, you'll change the symbology to show the buildings as an extension of the basemap. You'll also limit the distance at which the buildings are visible. Because the building dataset is large, limiting its scope helps the entire scene draw faster.
- In the Contents pane, click the SanFrancisco_Bldgs layer to select it.
- On the ribbon, click the Scene Layer tab. In the Visibility Range group, set Out Beyond to 5,000 ft.

The visibility range specifies the extents at which the layer will be visible. If you zoom out beyond 5,000 feet, the layer won't draw.
- In the Contents pane, expand the SanFrancisco_Bldgs layer and click the symbol.
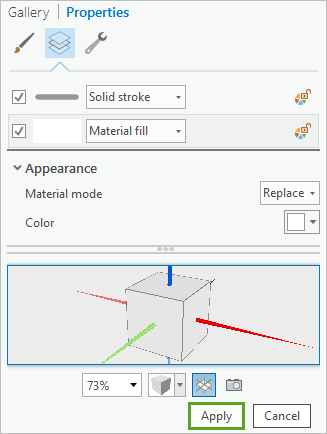
- In the Symbology pane, click the Gallery tab and choose the White (use textures) with Edges symbol.
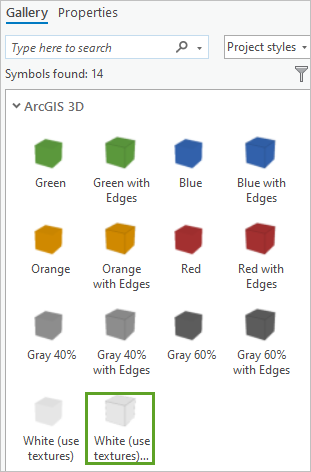
- Click the Properties tab and click Layers.
- Click Material fill to select the layer. Under the Appearance section, for Material mode, click the menu and choose Replace. Click Apply.
Now you still get the notion of human scale in the scene, but with a cleaner, more thematic appearance.
Measure impact of future transit
To communicate another human aspect of the scene, you'll add two more layers that show the number of people impacted by the existing and proposed transit lines. Two layers show projected housing data for each neighborhood and each transit station. There are also two walkshed layers that show areas within a 5-, 10-, and 15-minute walk from each stop.
- In the Contents pane, turn on the Housing (by Neighborhood) layer.
- Explore the layer, and then turn it off and turn on Housing (by Transit Stop).
Extruded-cylinder symbology has been used for these two layers. They are using a vertical offset of 250 meters, so they float above the ground without interfering with the buildings or rail lines yet are still easily referenced to the area that they represent.
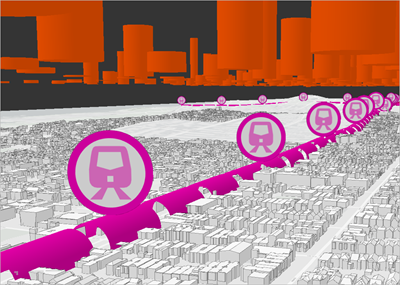
The walkshed layers communicate how close the transit stops are to people's homes. The polygons show a 5-, 10-, and 15-minute walk time.
- On the ribbon, on the Map tab, in the Navigate group, click Bookmarks. Click the START bookmark.
The map zooms out to show all of San Francisco.
- In the Contents pane, in the 2D Layers group, turn the two Walksheds layers on and turn off Housing (by Transit Stop).
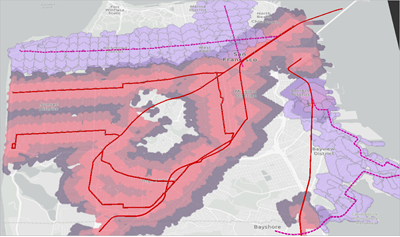
The Walksheds - NOW layer is already symbolized, with light pink showing a 5-minute walk and dark purple showing a 15-minute walk. The Walksheds - FUTURE layer isn't symbolized yet, with each of these three zones shown in the same light purple. To quickly apply the same symbology to the Walksheds - FUTURE layer, you'll import the symbology for the Walksheds - NOW layer.
- Right-click Walksheds - FUTURE and click Symbology.
Before, you clicked the layer's symbol to open the Symbology pane. This method brings you to the Primary symbology view instead of directly into the Gallery.
- In the Symbology pane, in the upper right corner, click the options button and click Import Symbology.
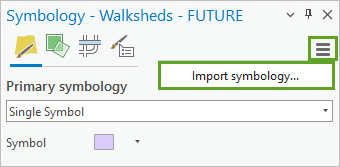
The Geoprocessing pane appears showing the Apply Symbology From Layer tool.
- In the Geoprocessing pane, for Symbology Layer, choose Walksheds - NOW. Click Run.
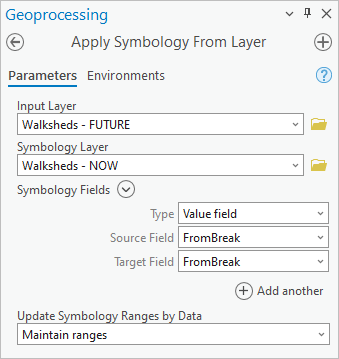
The Walksheds - FUTURE layer is symbolized the same as the Walksheds - NOW layer.
- Save the project.
Your scene is now fully authored. You've symbolized all the 3D data layers necessary to give an informative and interesting picture of the city's transportation future. Next, you'll begin creating the animation.
Create an animation
Previously, you got all the data in order. Now you're ready to start creating the animation. You'll begin by deciding what scenes you want the audience to see to best tell your story. You'll add keyframes at these locations, or fixed points that you want the camera to zoom past during the animation. Once you've decided the visual aspect of the animation by creating all the keyframes, you'll add explanatory text and supporting legends, and finally export the animation as a video that you can share to the city's social media following to inform them about the planned transit changes.
Add keyframes
First, you'll start the animation by adding keyframes. The Animation Timeline allows you to create and manage the keyframes that define the flow of your video. The camera path, angles, speed, and layer visibility are all decided by the keyframes you choose. This means you can author a full video by defining a set of important view states to pass through.
- If necessary, open your SF Transit Extension project.
- On the ribbon, click the View tab. In the Animation group, click Add.

The Animation Timeline pane appears at the bottom of the map view. You may already be zoomed to the START bookmark, but to ensure this, you'll choose the bookmark again.
- On the ribbon, click the Map tab and navigate to the START bookmark.
- Turn layers on and off until the following are the only visible layers:
- Transit Stops
- Transit Lines
- Light Gray Reference
- Light Gray Base
Note:
To quickly turn all layers on or off, press Ctrl and click a layer.
- In the Animation Timeline pane, click Create first keyframe.
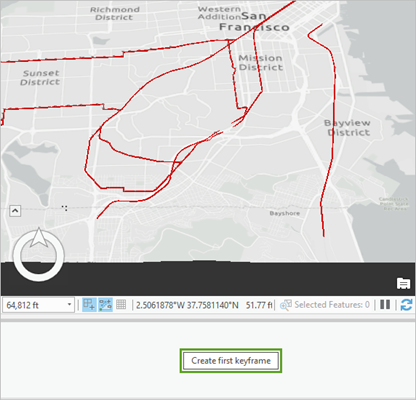
For the first section of the video, you want to provide an overview. You'll keep the camera in the same location while cycling through important layers. This allows users to see the change in the scene without being distracted by camera movement.
- In the Contents pane, turn on the Walksheds - NOW layer.
- In the Animation Timeline pane, in the Keyframe Gallery, click the Append next keyframe button to add a second keyframe.
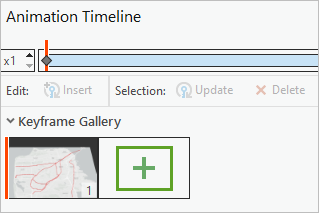
The default duration between keyframes is 3 seconds, so your video is now 3 seconds long. You can view more detailed information about your animation on the contextual ribbon tab. The default keyframe append time, and the total duration of the animation, can be viewed and edited on the Animation ribbon. You'll create all the keyframes first, and then fine-tune the timing later.
You need to turn on all the relevant layers, in the specific order, and move the camera around the scene to highlight key information. Remember, the story you are telling is how many people are covered by the existing rail coverage, and how many more will be covered after the new line is in place.
- Turn on the Housing (by Neighborhood) layer and add a third keyframe.
- Turn on the Transit Stops - FUTURE and Transit Lines - FUTURE layers. Add a fourth keyframe.
- Turn on the Walksheds - FUTURE layer and add a fifth keyframe.

The first five keyframes all use the same high viewpoint to provide an overview of the changes. They show, respectively, the current rail system, its coverage for commuters, the predicted housing growth of commuter housing, the proposed future rail system, and the improved coverage for commuters.
This is the core information of the video, but it's missing a more personal connection for people who live here. The display is too abstract and too distant to resonate strongly with residents. The rest of the animation will try to make a more personal and human connection with those watching.
- Save the project.
Use a fade-in effect
Now that you've given an overview of the city, you'll zoom in to individual streets and stops. Once zoomed in, the building data will display transit-stop-level housing information, rather than the coarse-grained neighborhood level. To create the fade-in effect, you'll need to change the visibility several steps before you want to show the layer fading in. If you turn it on without first making the layer transparent, it will flash on and off, distracting from the visual.
- In the Animation Timeline pane, double-click the fourth keyframe.
Double-clicking a keyframe zooms to that view and turns the corresponding layers on and off.
- In the Contents pane, click the Housing (by Transit Stop) layer to select it.
Note:
Do not turn the layer on.
- On the ribbon, on the Feature Layer tab, in the Effects group, set Transparency to 100%.

- In the Animation Timeline pane, click Update.
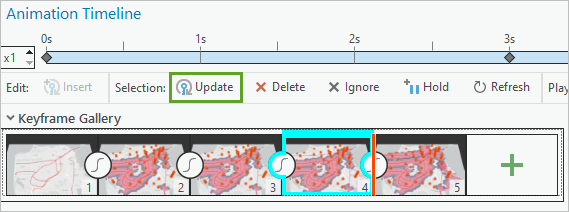
- Double-click the fifth keyframe and follow the same process to give the Housing (by Transit Stop) layer a transparency of 100%.
- In the Contents pane, turn on the Housing (by Transit Stop) layer and update the keyframe.
Now that you've established the layer's transparency, you'll make it visible. At the same time, you'll turn off the Housing (by Neighborhood) layer. This iterative process is necessary because otherwise the keyframe will capture the layer as visible, and it will flash on and off.
- In the Contents pane, make sure the Housing (by Transit Stop) layer is selected. On the Feature Layer tab, set Transparency to 0%.
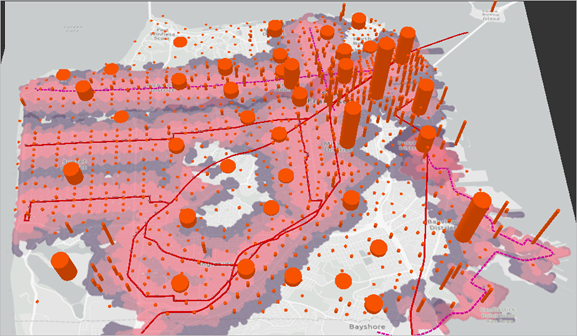
At this intermediate step, both housing layers will be visible. During your animation, both of these layers will be visible briefly before you turn the neighborhood data off.
- Select the Housing (by Neighborhood) layer and set Transparency to 100%. Add a sixth keyframe.
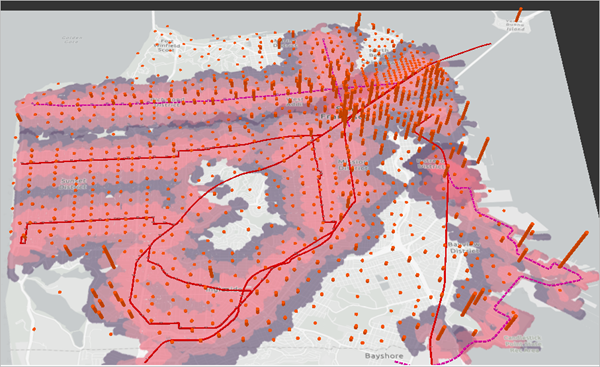
Between the fifth and sixth keyframe, the Housing (by Neighborhood) layer will fade out, and the Housing (by Transit Stop) layer will fade in.
Next, you'll move the camera through the scene at an altitude that makes viewers more immersed in the content.
- On the ribbon, click the Map tab and navigate to the FLY-THRU 1 bookmark.
- In the Animation Timeline pane, add a seventh keyframe.
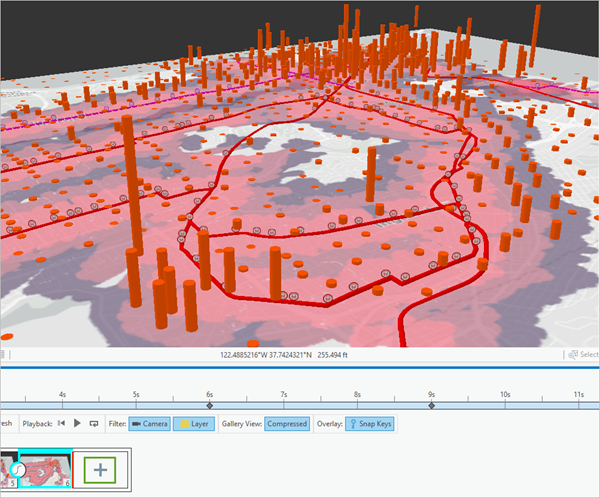
- Add an eighth keyframe for the FLY-THRU 2 bookmark.
- Add a ninth keyframe for the FLY-THRU 3 bookmark.
- Add a tenth keyframe for the START bookmark.

You can now preview the entire animation. It has a duration of 27 seconds.
- On the ribbon, on the Animation tab, in the Playback group, click the Reset button and click Play.

Content is now displaying in the correct order, and the fly-through will take the camera close to the ground along the east-west proposed railway line in the north side of the view. Don't worry if the buildings layer didn't appear—the display may not be able to keep up when viewed in real time, but when exporting to a video file each frame will use as much time as it needs to render.
Add overlays
While the scene animation is now complete, you don't have any information explaining what the content means. You'll use overlays to add a title, explanation text, and legend images. By default, overlays are added to the selected keyframes, so selecting the right keyframes before inserting any overlay text or imagery is crucial.
- In the Animation Timeline pane, click the first keyframe, press the Shift key, and click the tenth keyframe.
All keyframes are selected.
- On the ribbon, on the Animation tab, in the Overlay group, expand the Add Overlay gallery and click Outline Title.
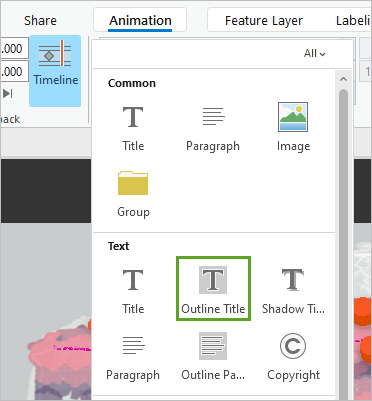
A text box is added to the top of the map.
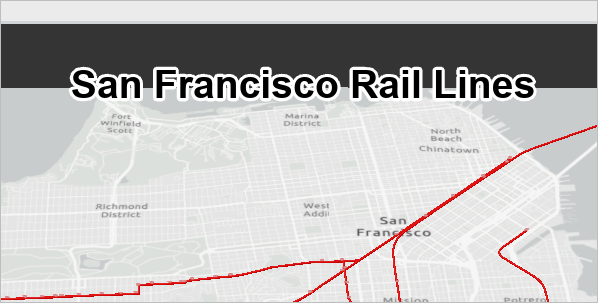
- In the title text box, type San Francisco Rail Lines. Click the close button to stop editing the text.
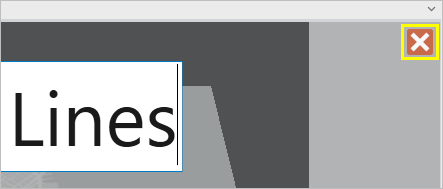
- On the Animation tab, in the Overlay group, change the text size to 36.
The title text size changes for all the slides.
- In the Animation Timeline pane, select the second keyframe.
Next, you'll add legends explaining what the symbology on each keyframe shows. The legend images were packaged with the map project, and are contained in the default folder structure.
- On the ribbon, in the Add Overlay gallery, click Image. Browse to the Packages folder in your default ArcGIS folder and open the TransitLineExtension package. Double-click commondata, open userdata, and choose Legend1.png .
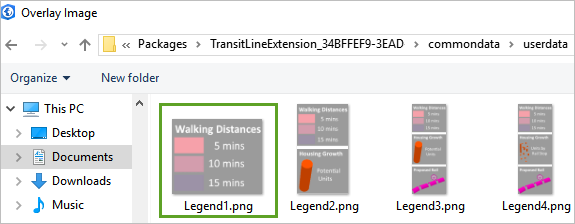
- Click Open.
- On the ribbon, on the Animation tab, in the Edit group, click Properties.

The Animation Properties pane appears.
- In the Animation Properties pane, click the Overlays tab and select the Legend1.png element. In the Position section, choose the option in the upper right corner.
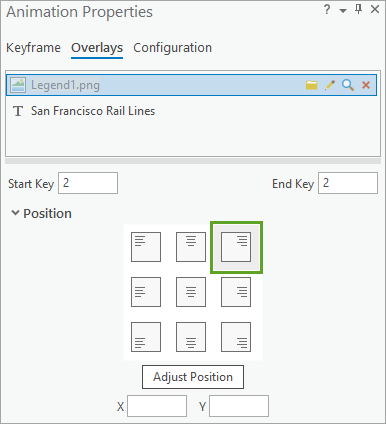
The legend moves to the upper right corner of the frame. You still need to add several legend items.
- In the Animation Timeline pane, select the third keyframe.
- On the ribbon, add another image overlay and choose Legend2.png.
- In the Animation Properties pane, select the Legend2 element and format it to the upper right of the frame.
- In the Animation Timeline pane, select the fourth and fifth keyframes.
- Add another image overlay and choose Legend3.png. Use the Animation Properties pane to position it in the upper right of the frame.
- Add Legend4.png to the sixth and seventh keyframes and position it at the upper right of the frame.
- In the Animation Timeline pane, double-click the seventh keyframe to zoom to that point in the animation.
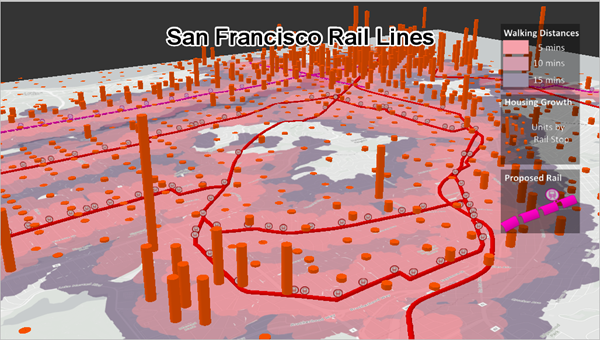
You now have most of the background information in place. The last element you'll add is text explaining the overall message of the animation.
- In the Animation Timeline pane, double-click the first keyframe to zoom to the start of the animation.
- Click Hold.
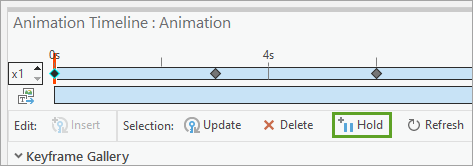
The hold option adds two seconds of still framing to the beginning of the animation. Instead of the camera beginning to move immediately when the animation begins, it will be motionless for two seconds to allow viewers to see the keyframe.
- Select the first three keyframes.
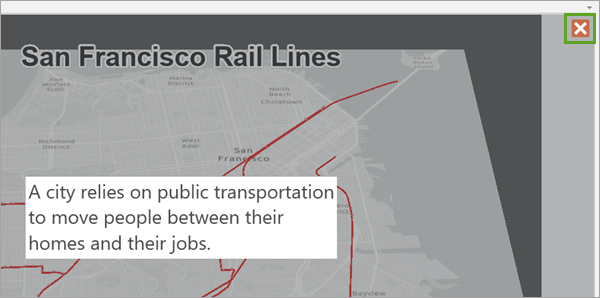
- On the ribbon, in the Overlay group, add a Paragraph overlay. Add the following three lines of text to the paragraph:
- On line 1, type A city relies on public transportation .
- On line 2, type to move people between their .
- On line 3, type homes and their jobs.
- When done, click the close button to complete text editing.
- In the Animation Timeline pane, double-click the fourth keyframe.
- Add another Paragraph overlay and type the following text: Especially when the city is growing.
- Click the close button and select the fifth, sixth, and seventh keyframes.
- Add a Paragraph overlay with the following text:
- On line 1, type The City of San Francisco wants to .
- On line 2, type extend the current rail line .
- On line 3, type to support this growth.
- Click the close button to close the overlay text editor and select the tenth keyframe.
- Add a Paragraph overlay with the following text:
- On line 1, type Learn more at.
- On line 2, type www.sfmta.com.
The animation is complete. Before you export the final product, you'll preview the animation to make sure there is enough time to read the text you added. The video needs to be short, so people will watch it all the way through, but not so fast that they can't take in the information.
- On the ribbon, in the Playback group, click Reset and click Play.
Your experience may be different, but it seems that while there's enough time to read the text, there's not quite enough time to also take in the map visuals changing behind the text, especially when the proposed rail lines first switch on.
- In the Animation Timeline pane, double-click the fifth keyframe.
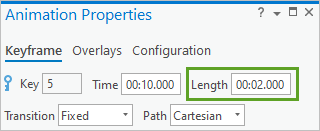
- In the Animation Properties pane, click the Keyframe tab and change Length to 2 seconds.
- In the Animation Timeline pane, select the sixth keyframe.
- In the Animation Properties pane, change Length to 5 seconds. Click the Overlays tab and select the The City of San Francisco element.
- Above Position, change Start Key to 6 and confirm End Key is set to 7.
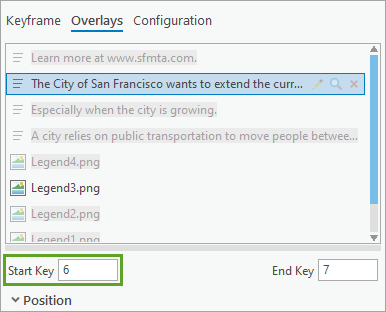
By changing this timing, you've effectively carved out a 2-second window where there is no text displayed and the proposed rail lines are switched on. You've also made sure there's still enough time after this gap for people to read the overlay text. Preview the animation again.
- On the ribbon, click Reset and click Play.
- Save the project.
Export video
Once you're satisfied with the animation, you'll export it to share. There are several presets that streamline this process.
- On the ribbon, on the Animation tab, in the Export group, click Movie.
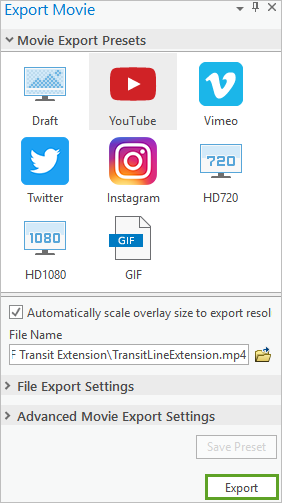
The Export Movie pane appears. In the pane, you can choose a preset option for the video file specifications.
- Under the Movie Export Presets, choose YouTube.
The YouTube preset creates a medium-quality 1280x620 .mp4 video file. If you choose other presets, the view size will adjust to the selected aspect ratio.
- For File Name, choose the project folder or another local drive and click Export.
Note:
The video may take a few minutes to export, depending on your machine and Internet speed. The section of frames where layer transparency is being changed will take a little longer than the rest of the export. You may choose to review the final result instead of waiting.
- When the export is finished, at the bottom of the Export Movie pane, click Play.
You can now upload the video to a platform such as YouTube or Twitter, or host it on a web page, and share the link.
You can find more tutorials in the tutorial gallery.
